



Subscription analytics
you can talk to
Accurate MRR, churn and LTV from the billing data you already have. Then ask Kometrics AI anything about your revenue and get an answer with the report behind it.
Free until your book passes $1,000 MRR. No credit card.
Reads the billing you already run, and merges it into one book
Bill on two providers and a customer who moved between them stays one customer with one continuous history, instead of showing up as a churn and a signup. How integrations work
Numbers you can check, not just charts you can show
Revenue reports, six explorer tools and an analyst that reads the same ledger they do.
Reports that agree with each other
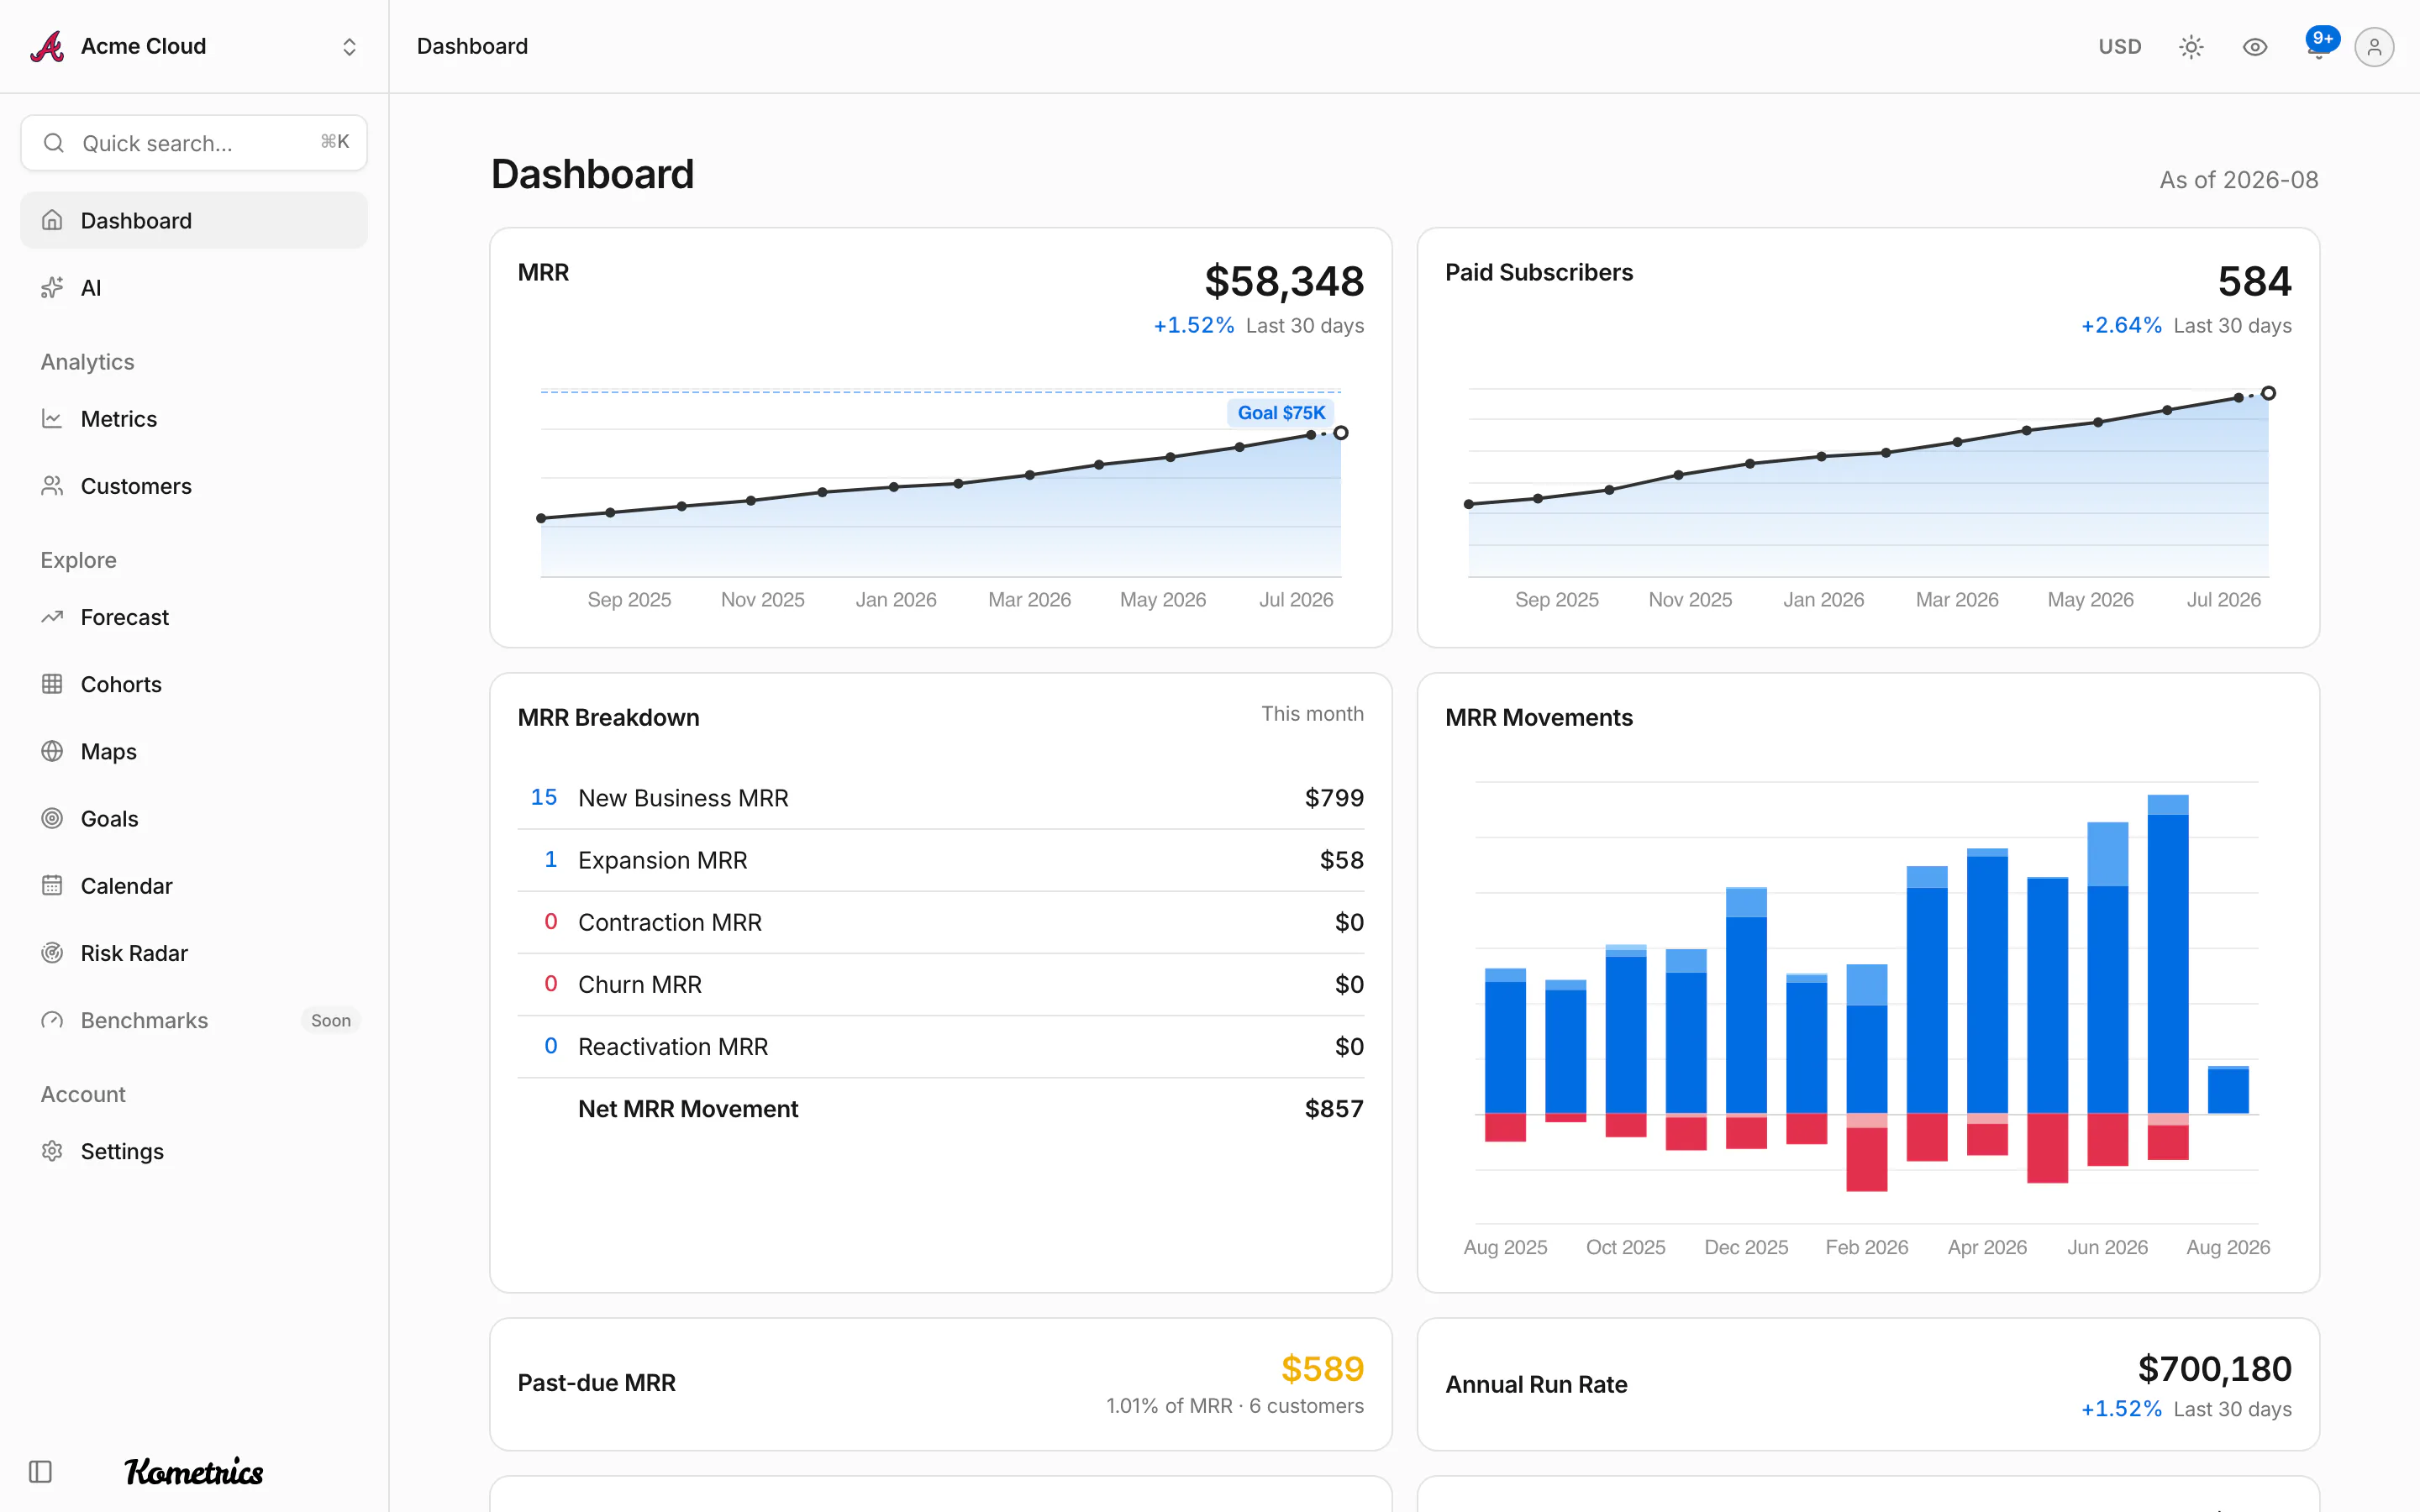
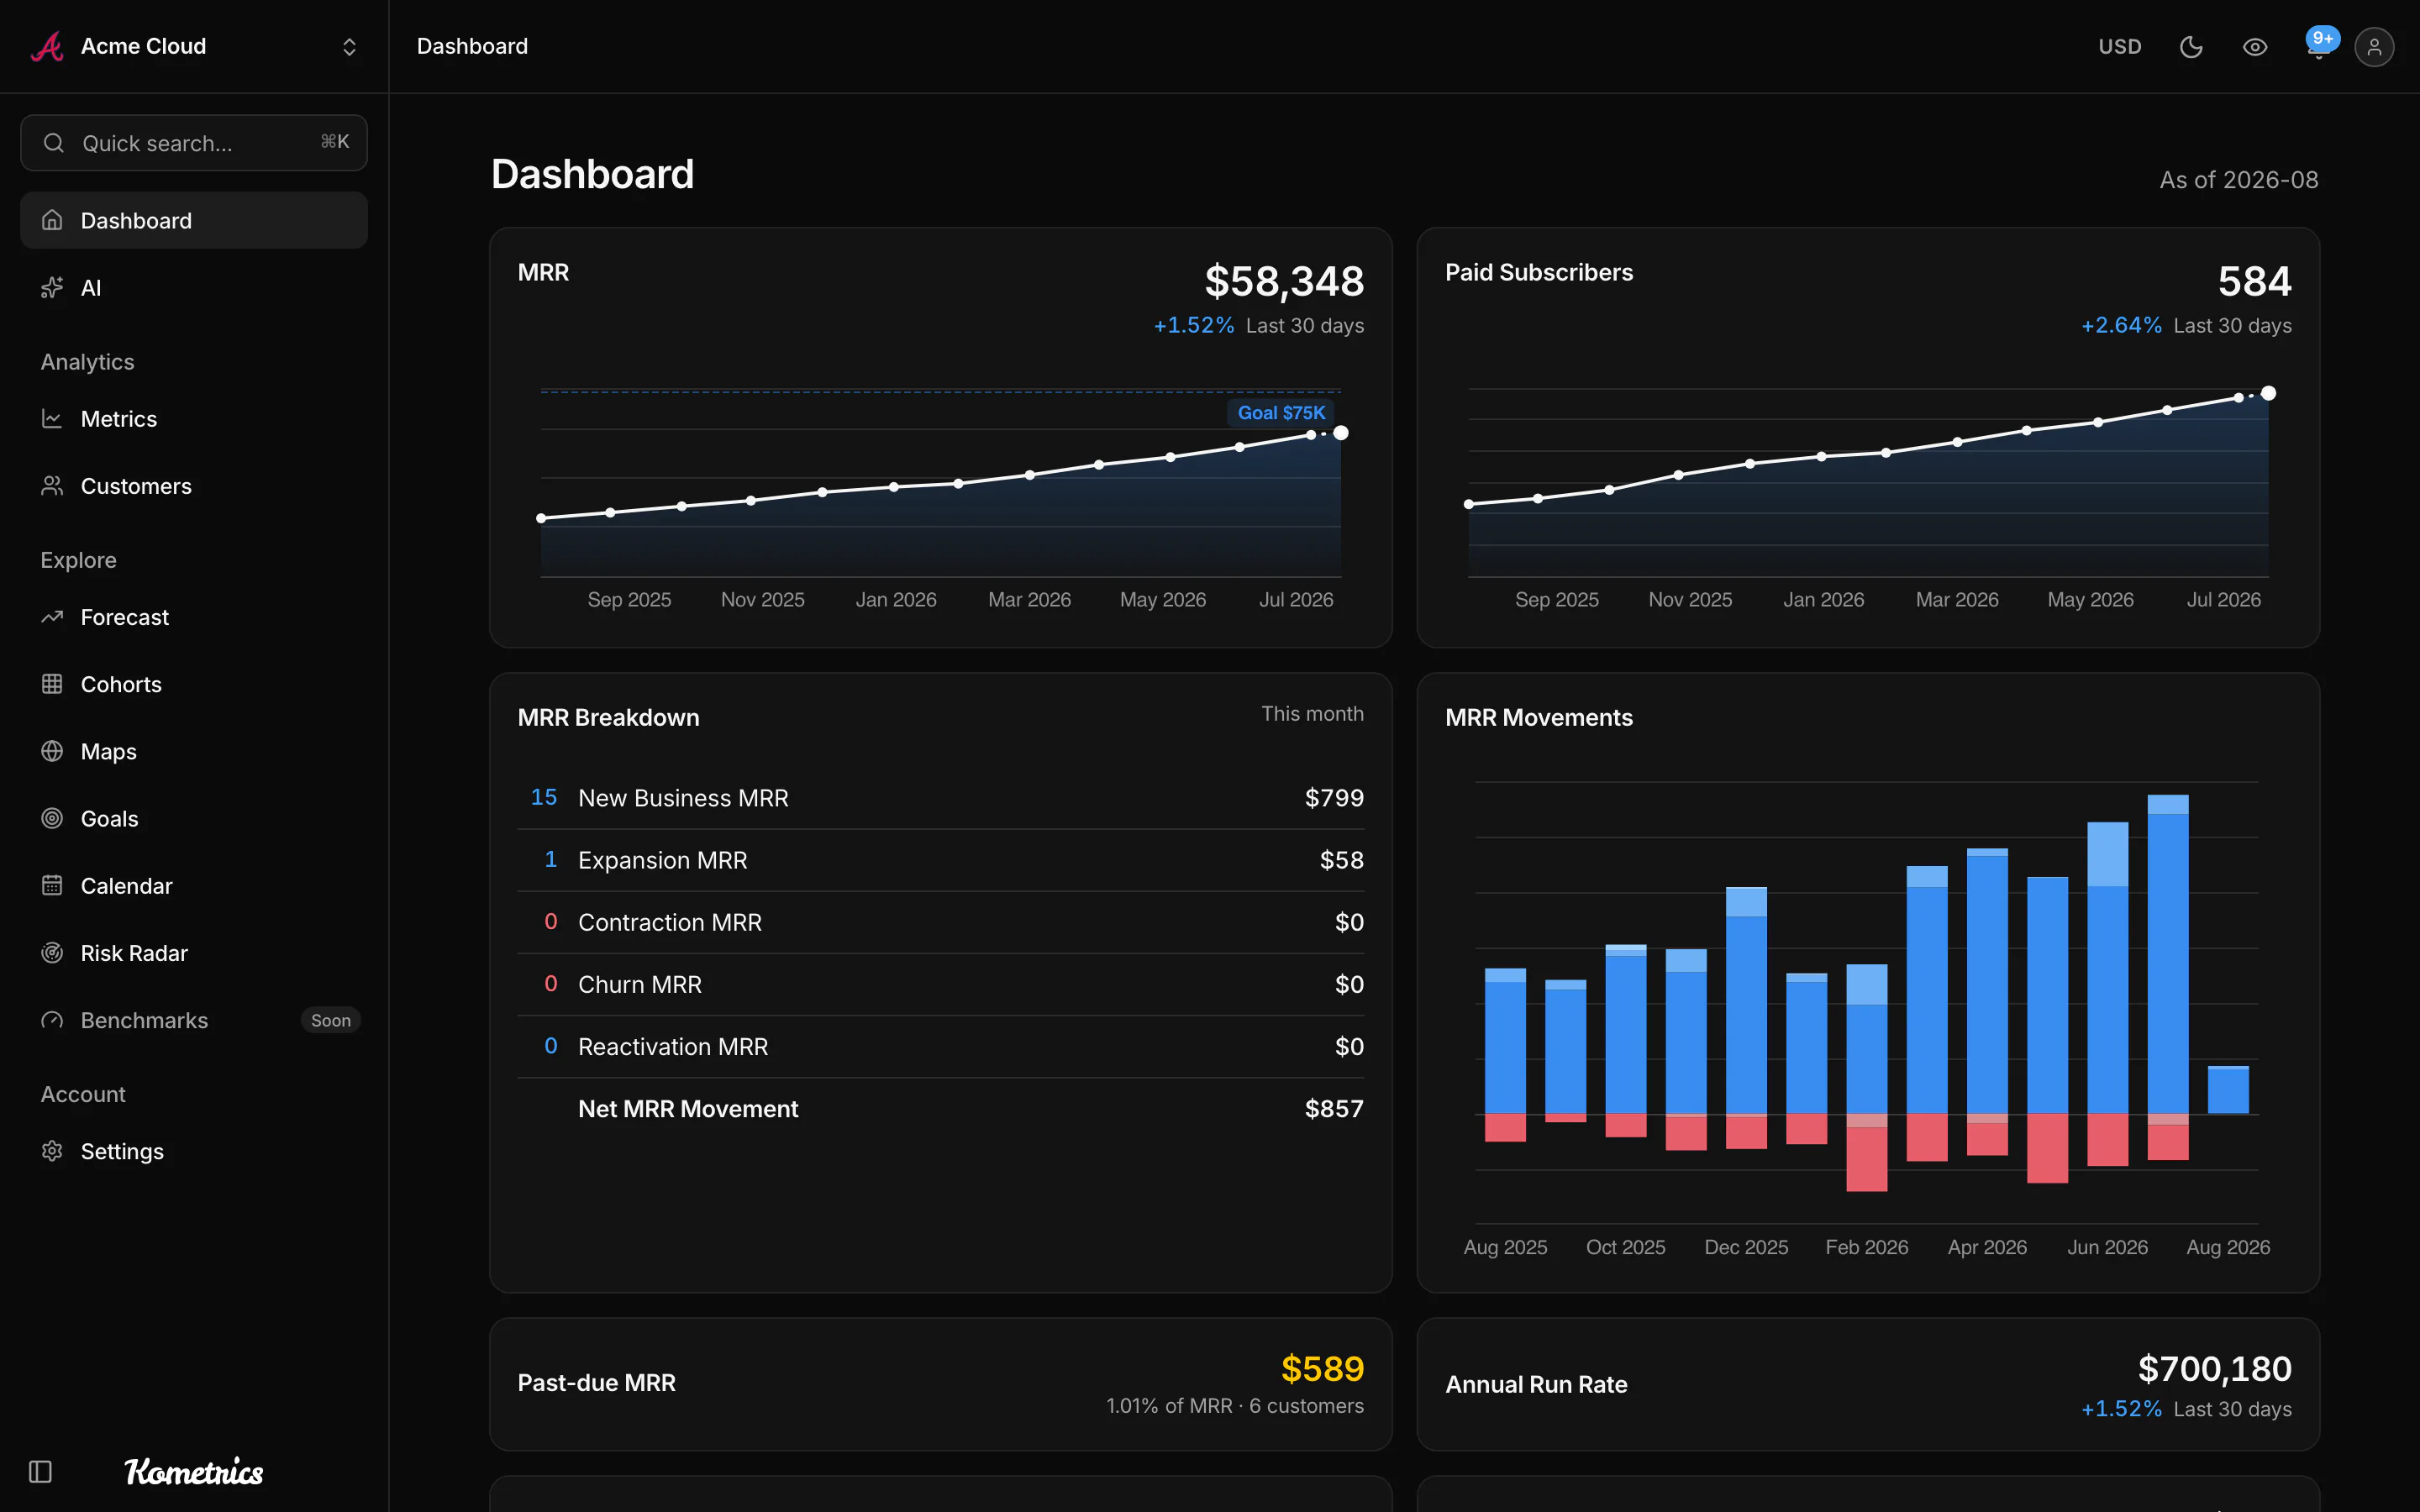
MRR, ARR, growth and churn rates, subscribers, ARPA and LTV, each with the period by period table under the chart. Proration, coupons, plan changes and multi-currency are resolved when the data is ingested, so the figure you present is the figure that survives being questioned.
- Daily through yearly, on every report
- Movement cells open the customers behind them
- The in-progress period draws dotted, never as a dip
Monthly Recurring Revenue
$43,612 +4.1%
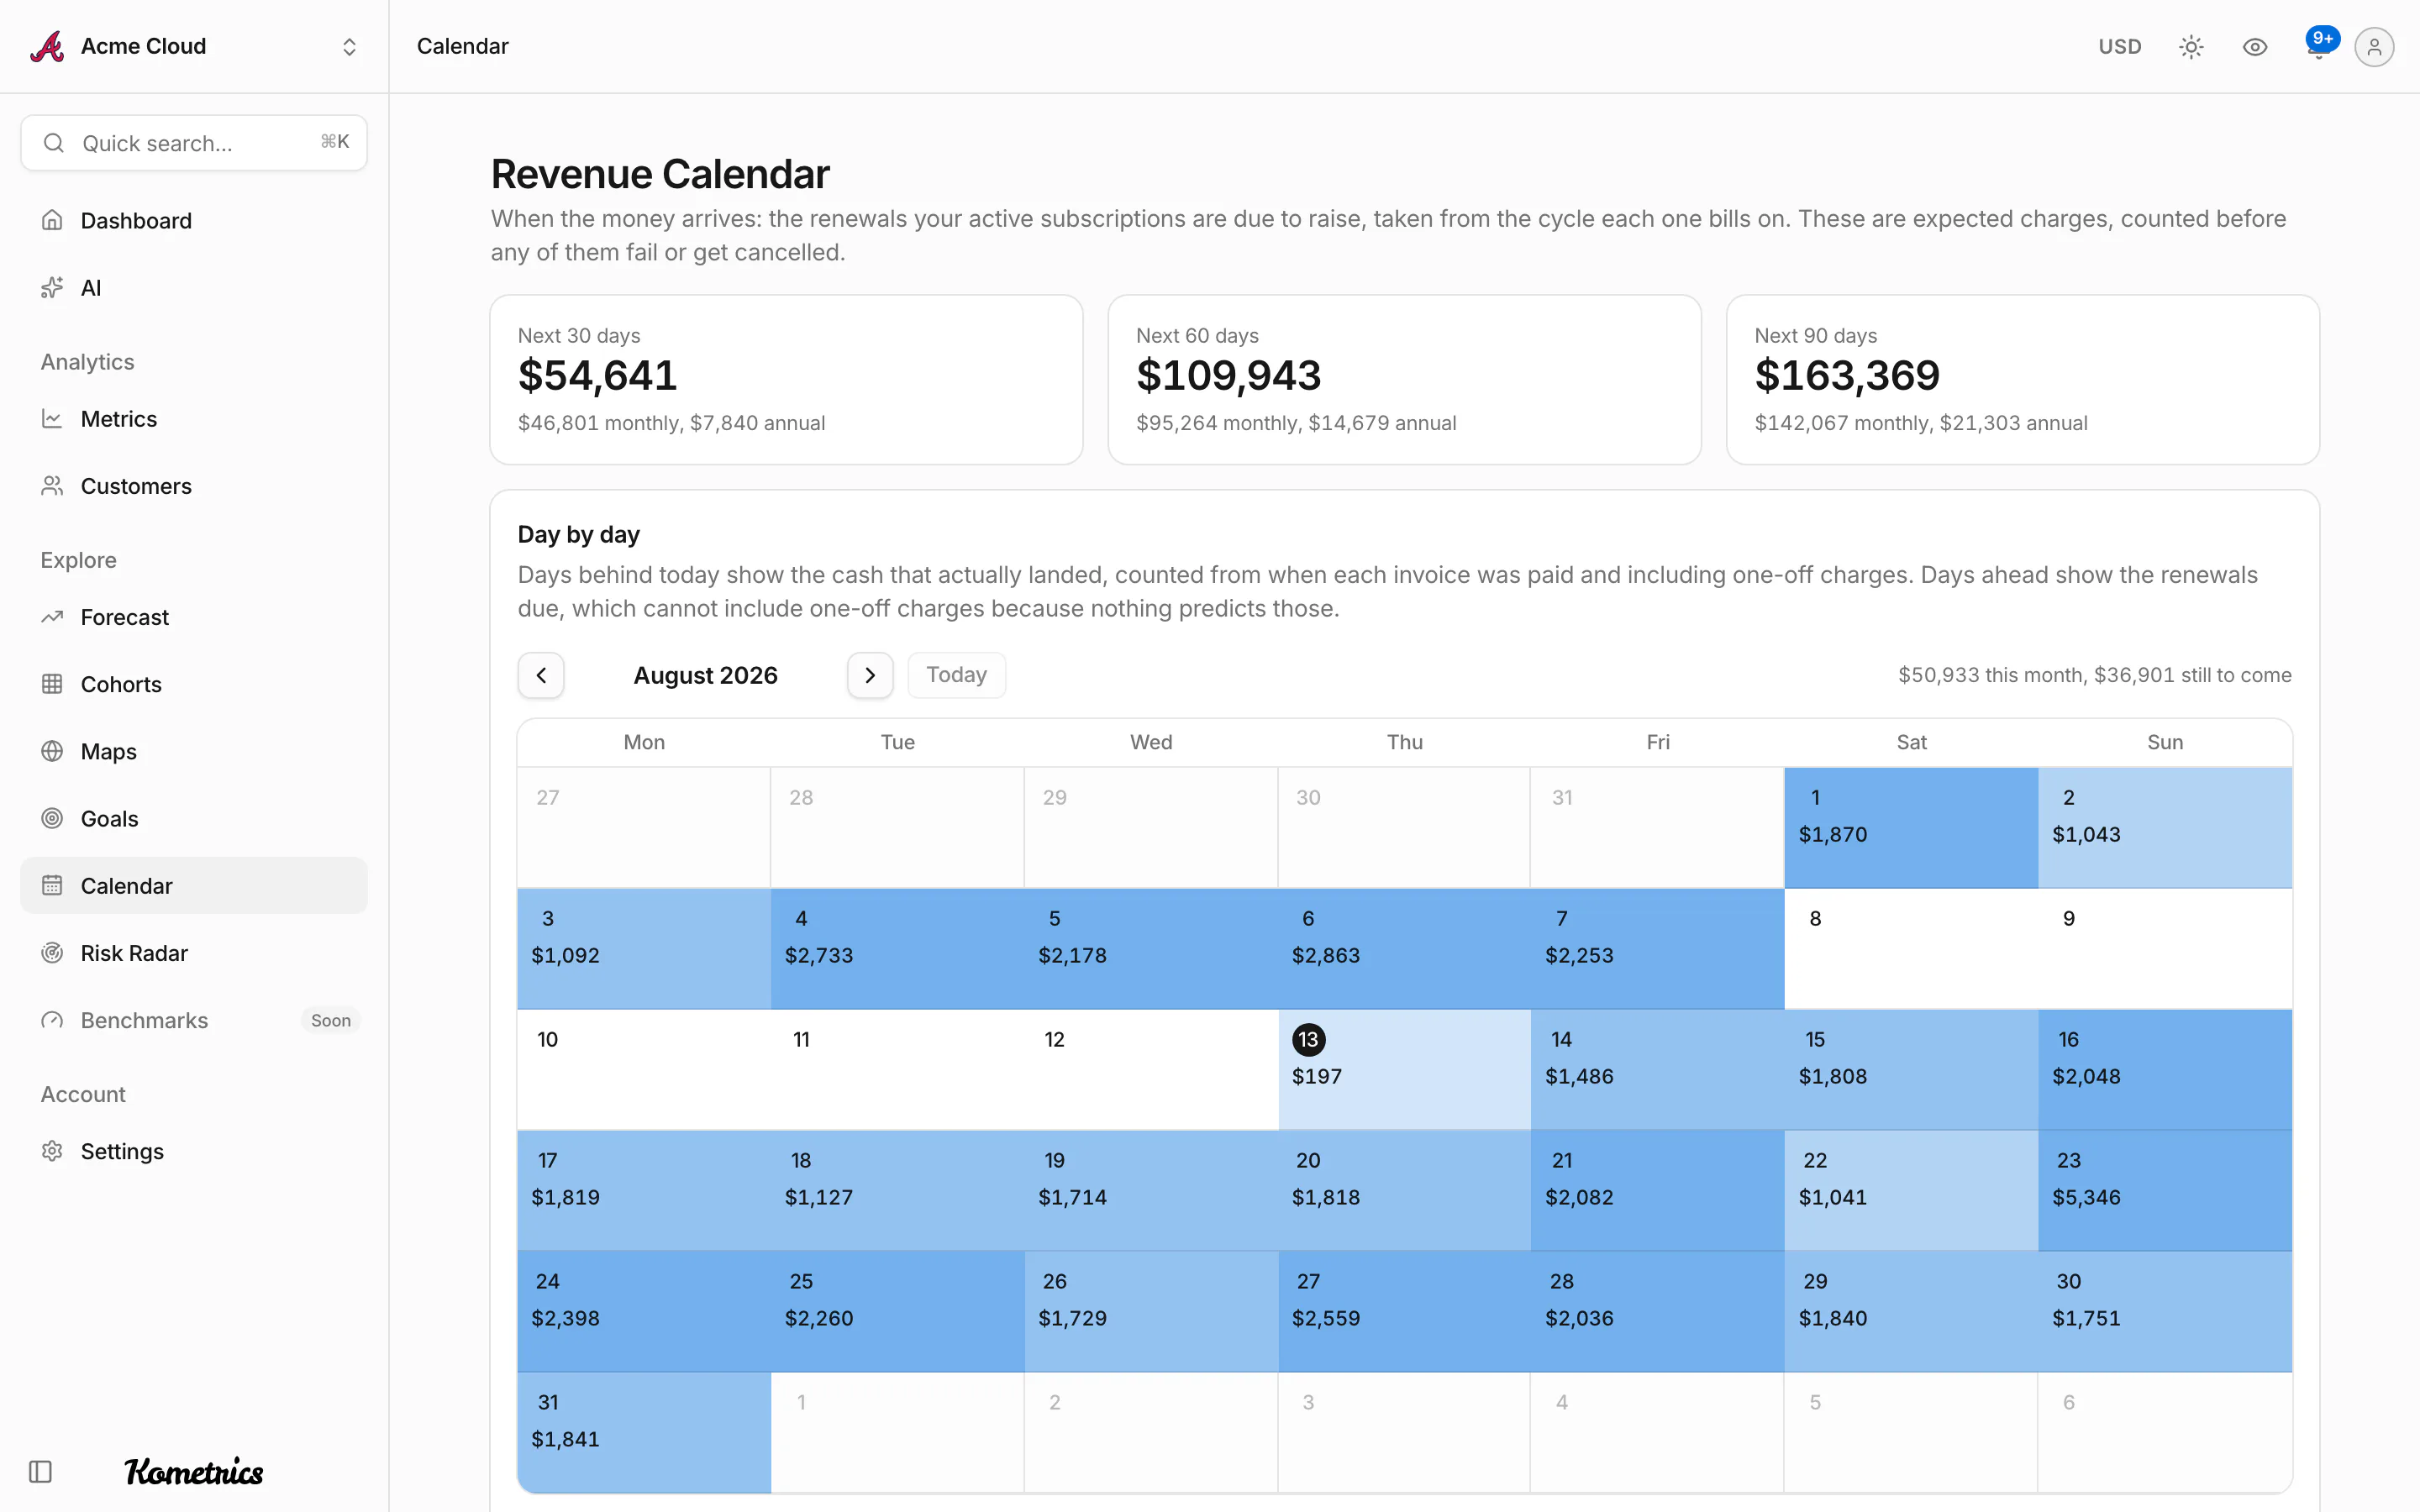
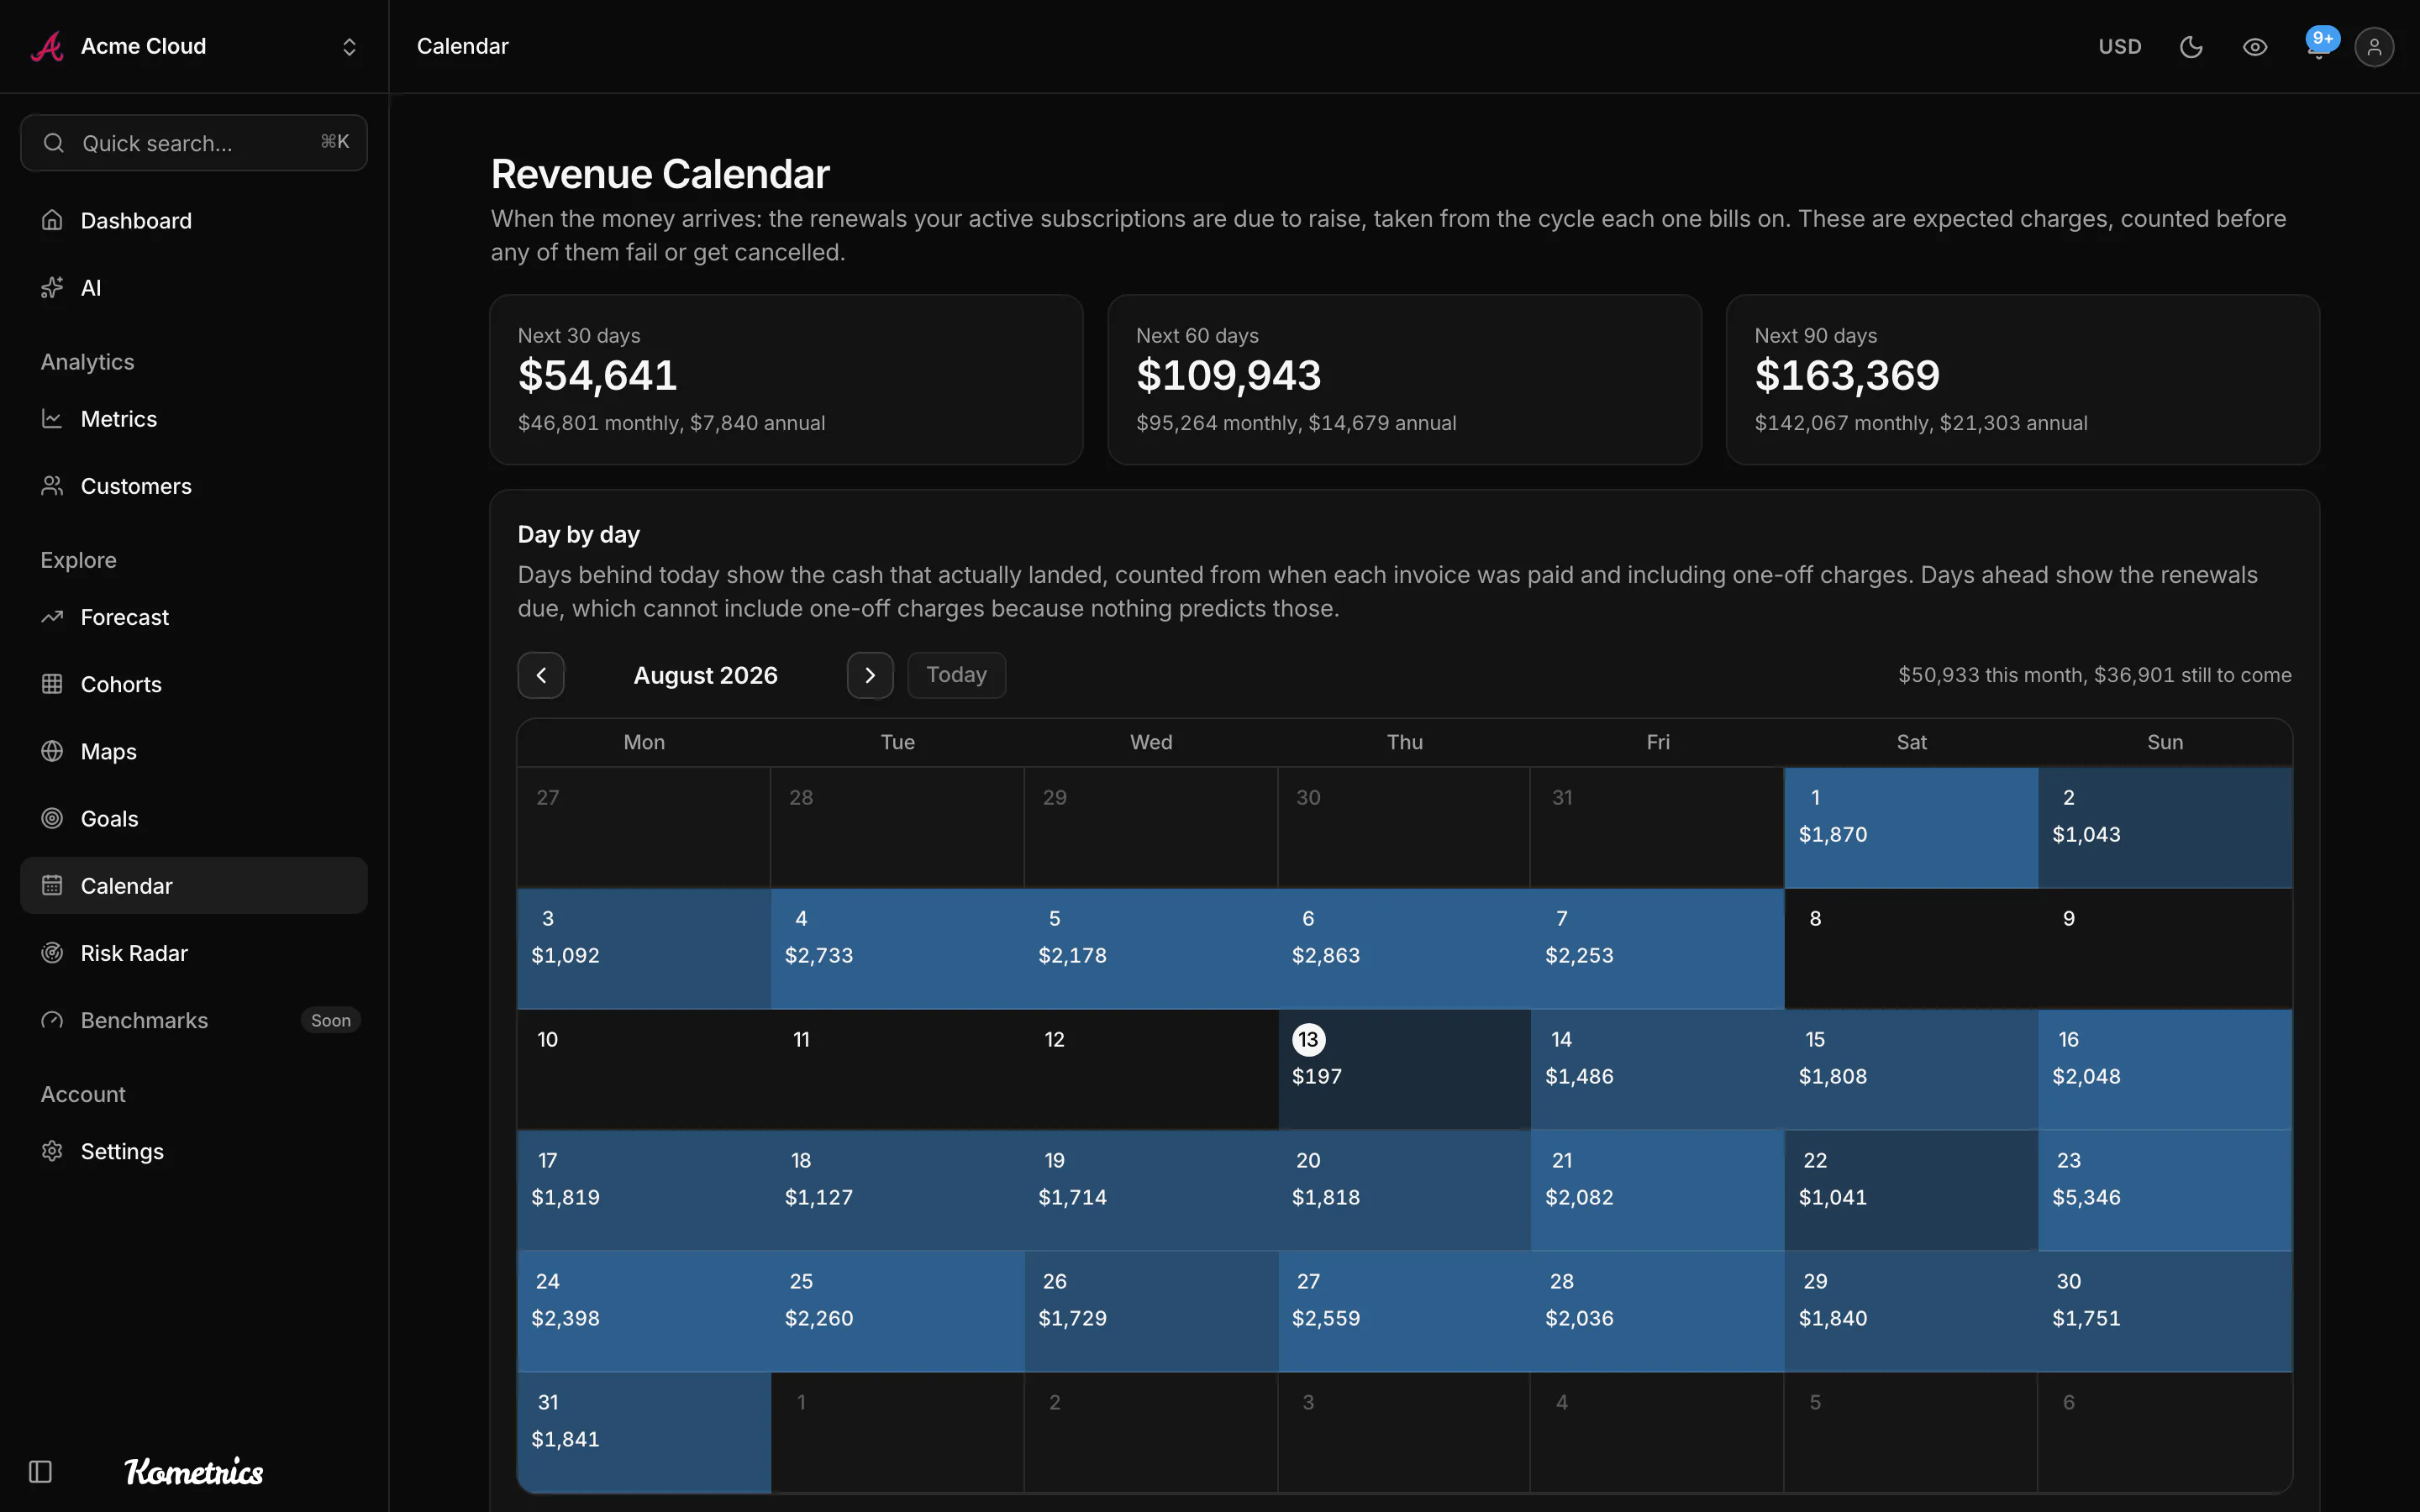
Tools for the questions a dashboard raises
A dashboard tells you MRR moved. It rarely tells you whether the customers you won this year stay longer than last year's, which days cash actually lands, or which revenue is already scheduled to leave. Six tools answer those directly.
- Forecast, Cohorts, Maps, Goals, Revenue Calendar and Risk Radar
- Each one reads the same ledger as the reports
- Built for the question, not for the screenshot
Ask your revenue a question
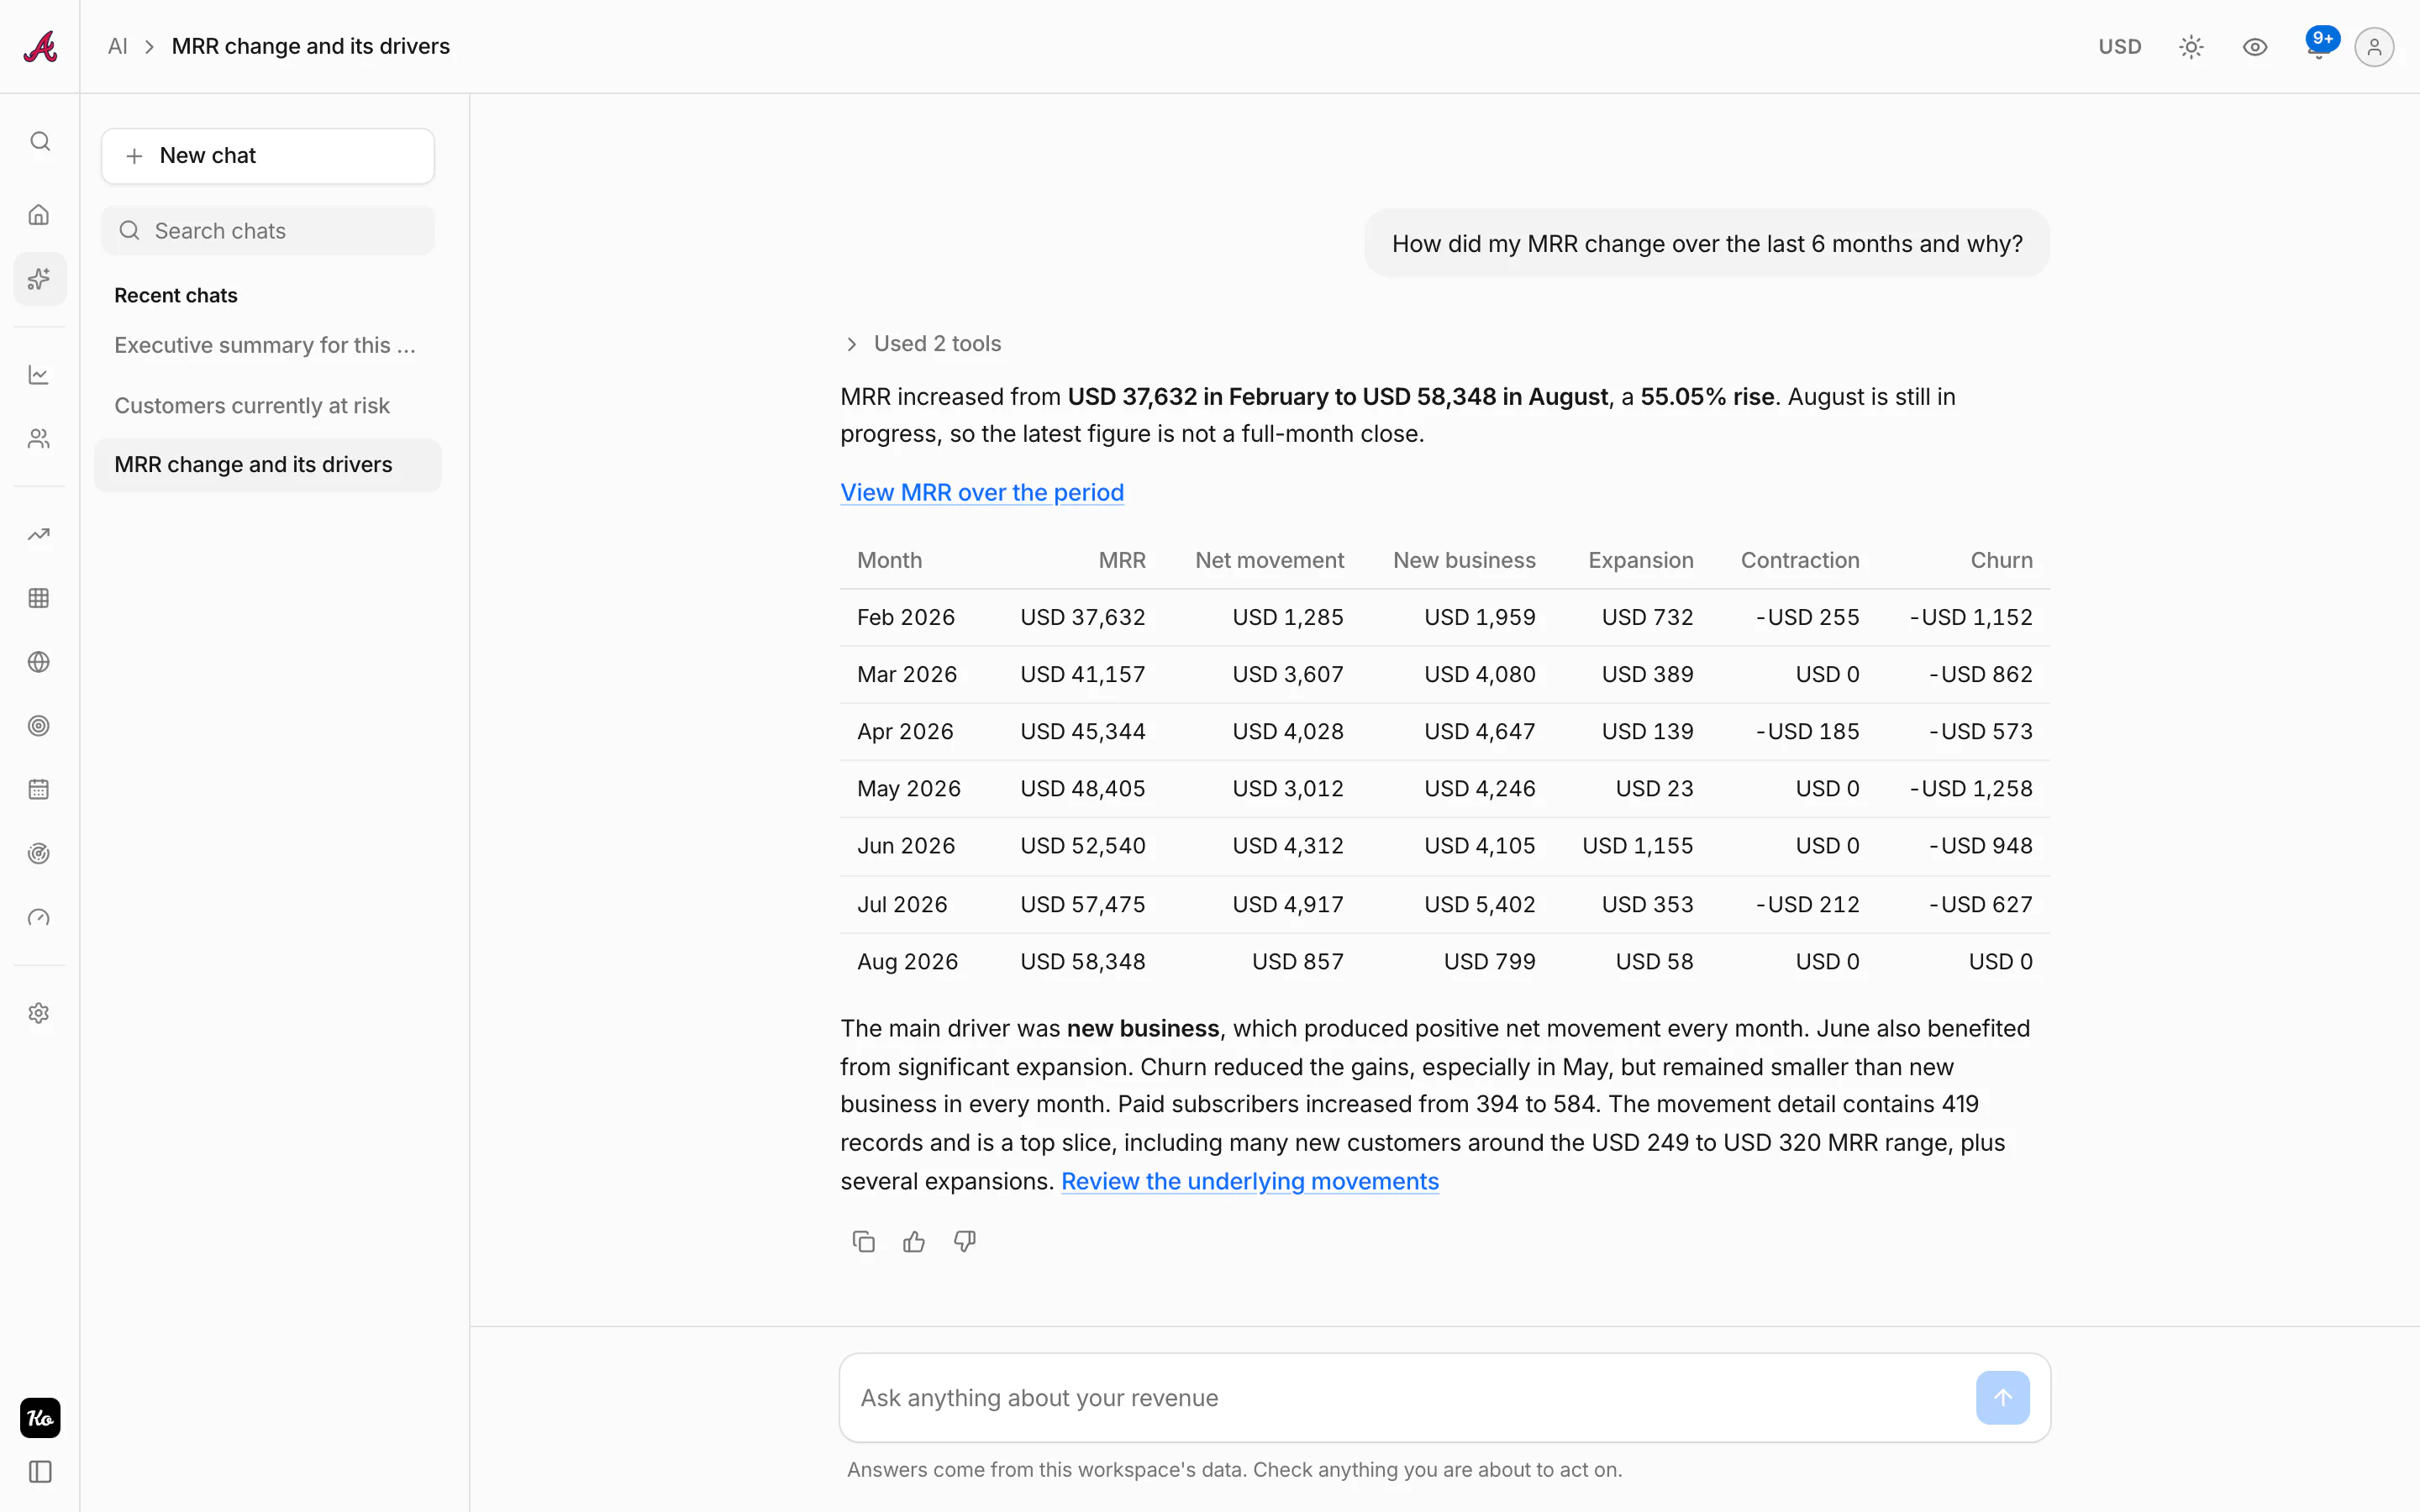
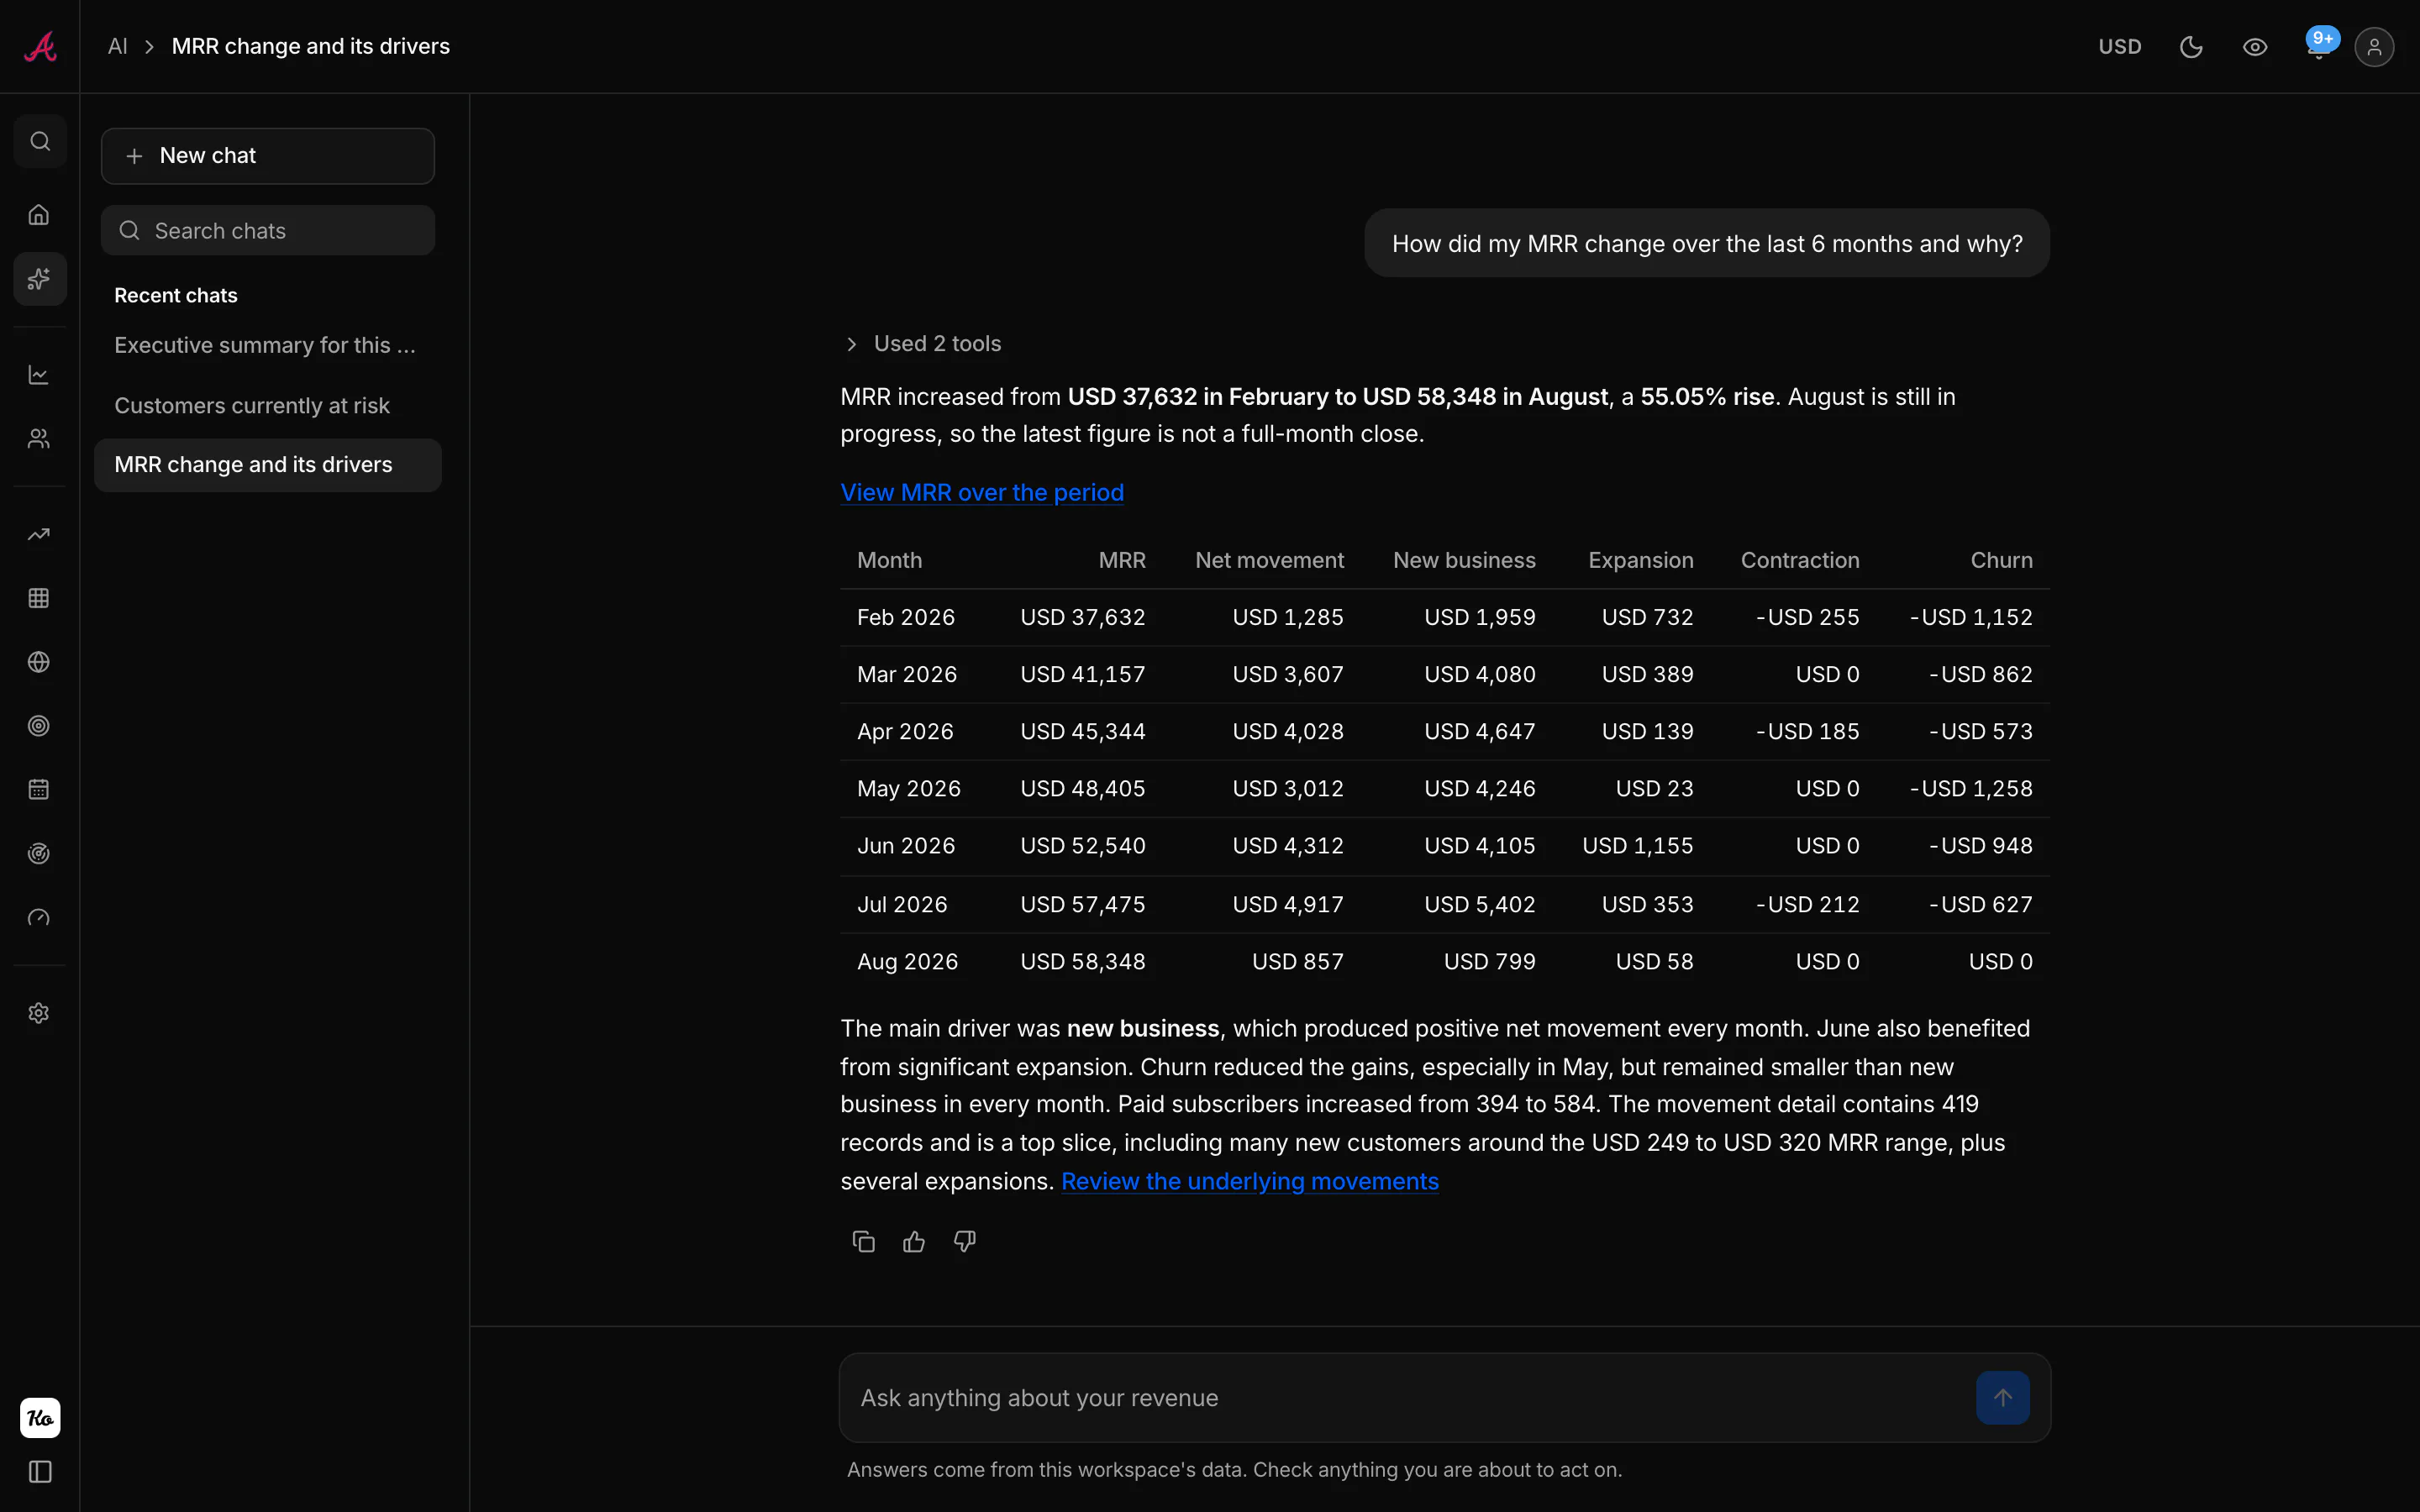
The analyst reads your ledger, so the answer comes back with your figures rather than a plausible-sounding average. It is fenced to one workspace in the code that runs the queries, not by asking it politely, and every answer links back to the report that produced the number.
- Reads the same metric series the reports draw
- Answers in tables, linked to the matching report
- Scoped to one workspace at the query layer
- The same answers inside Claude and ChatGPT, over MCP
Answered from your ledger
or in your own assistant, over MCPEvery number traces back to a name
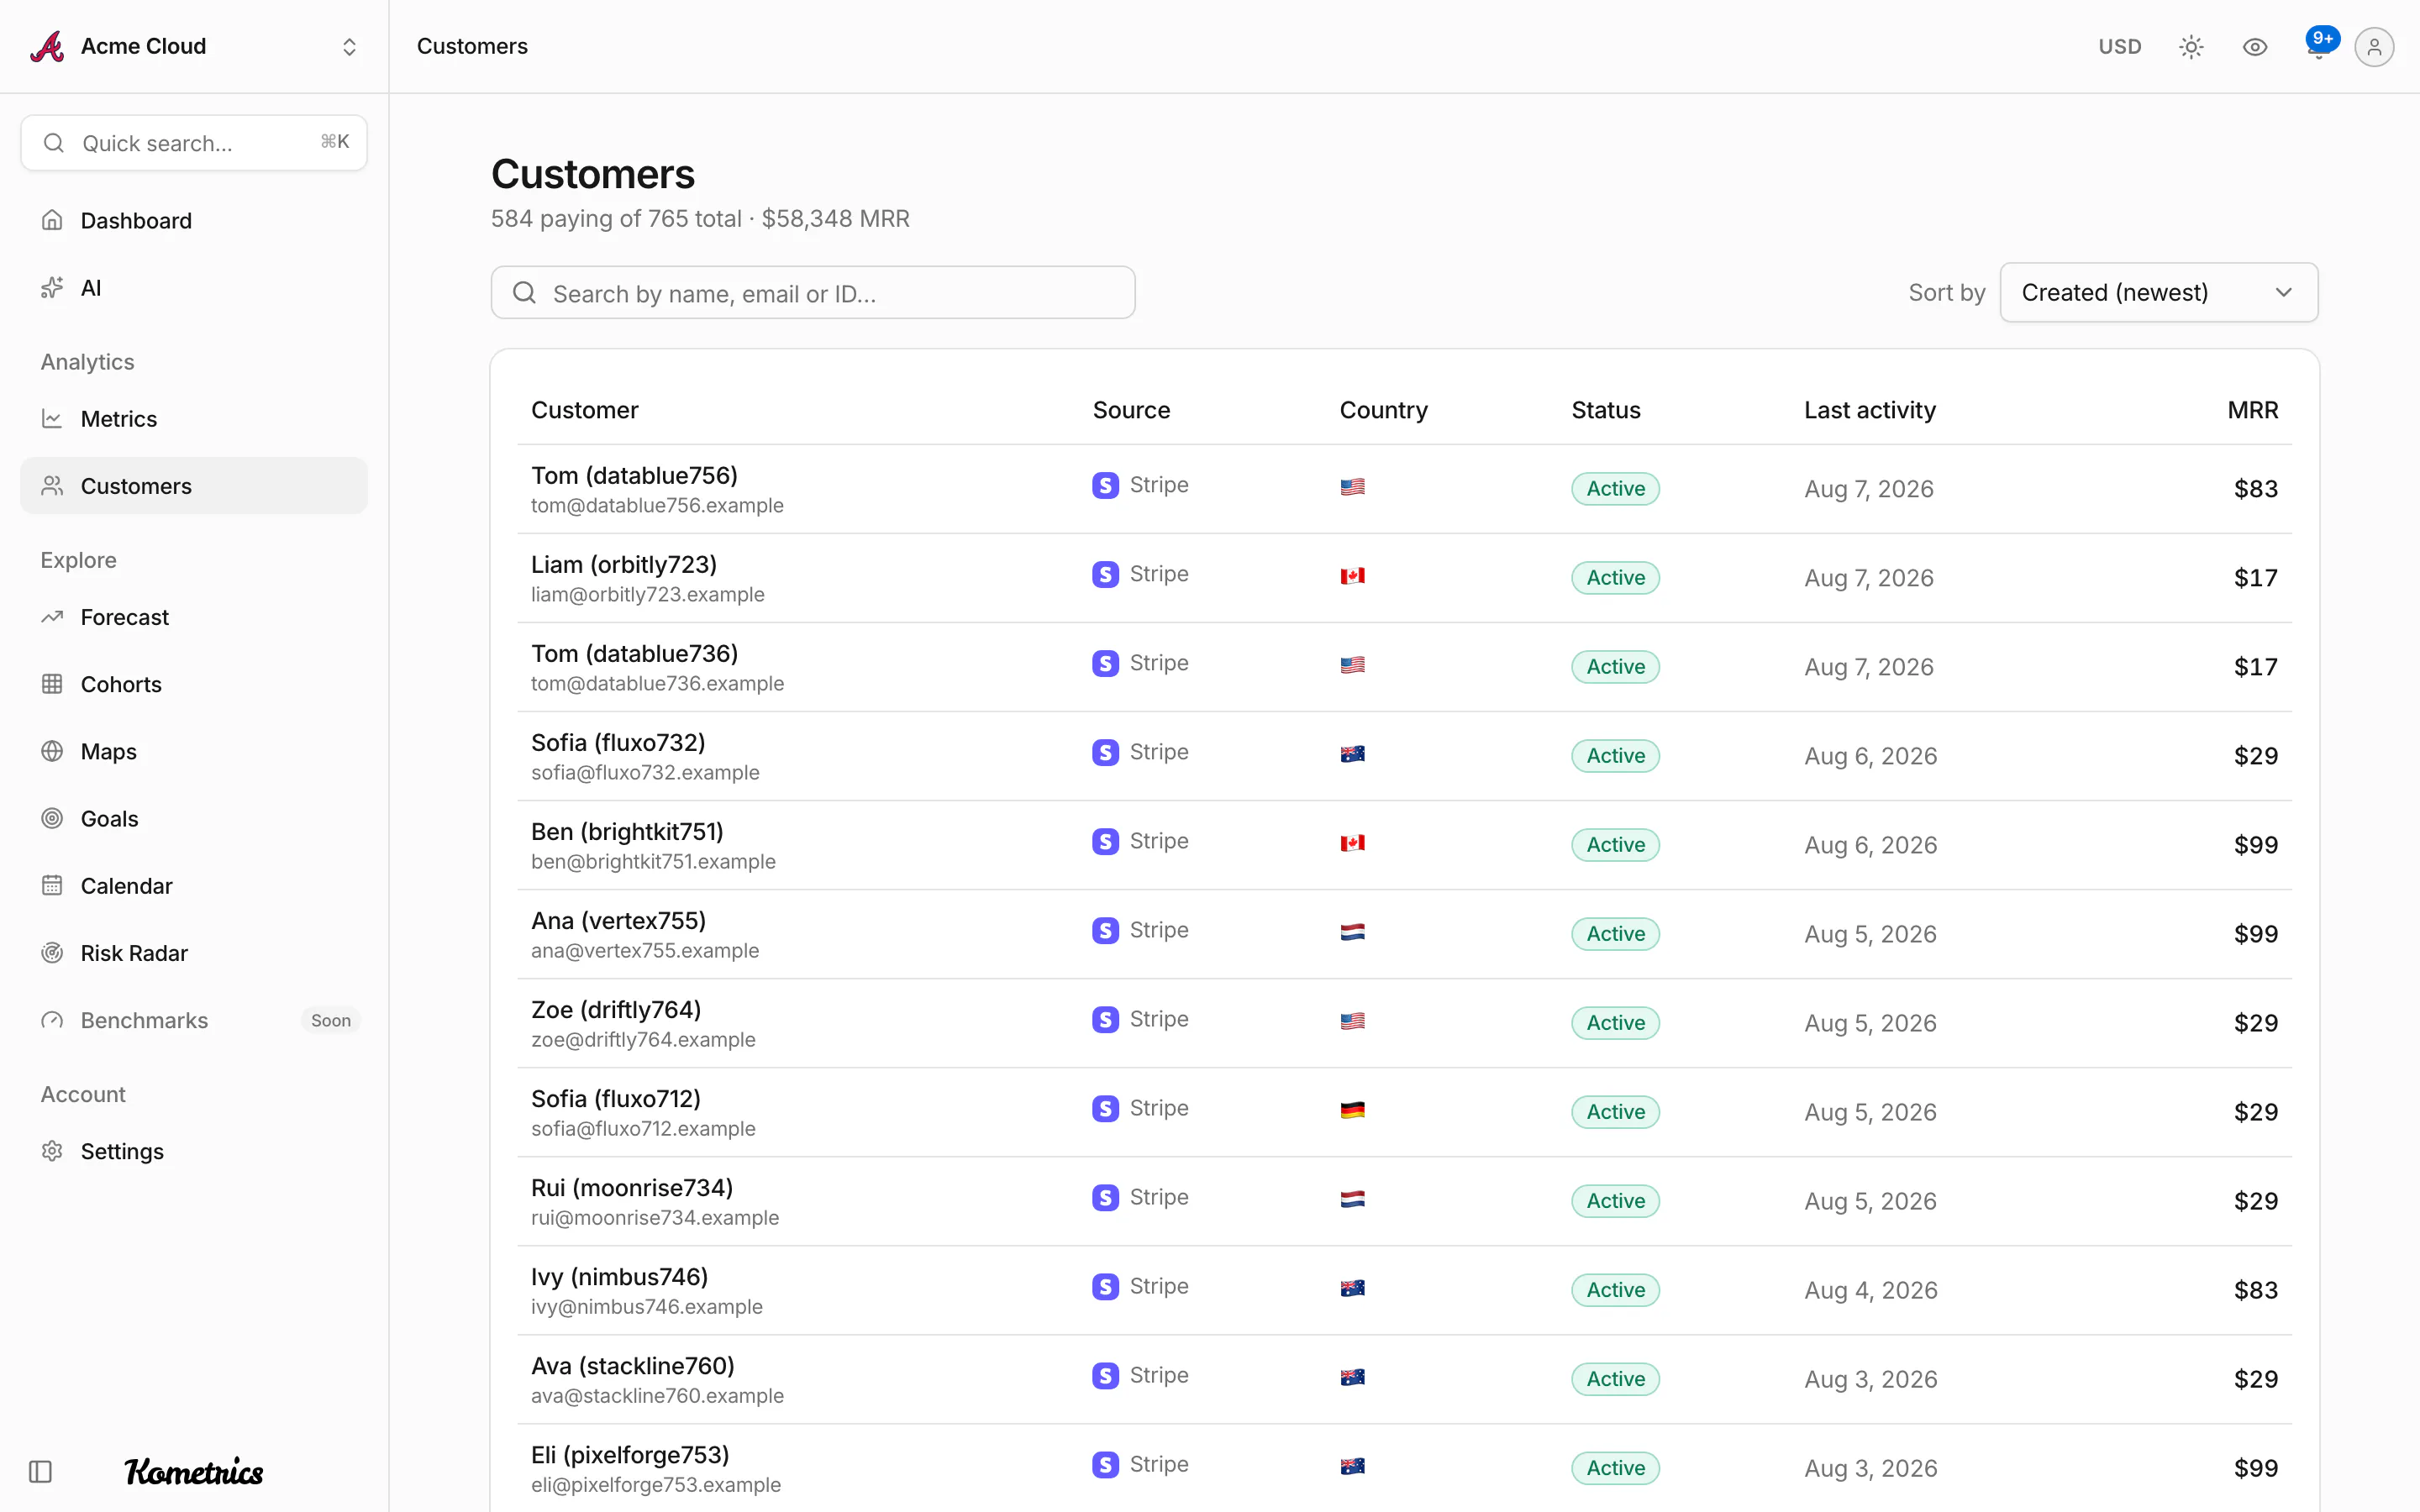
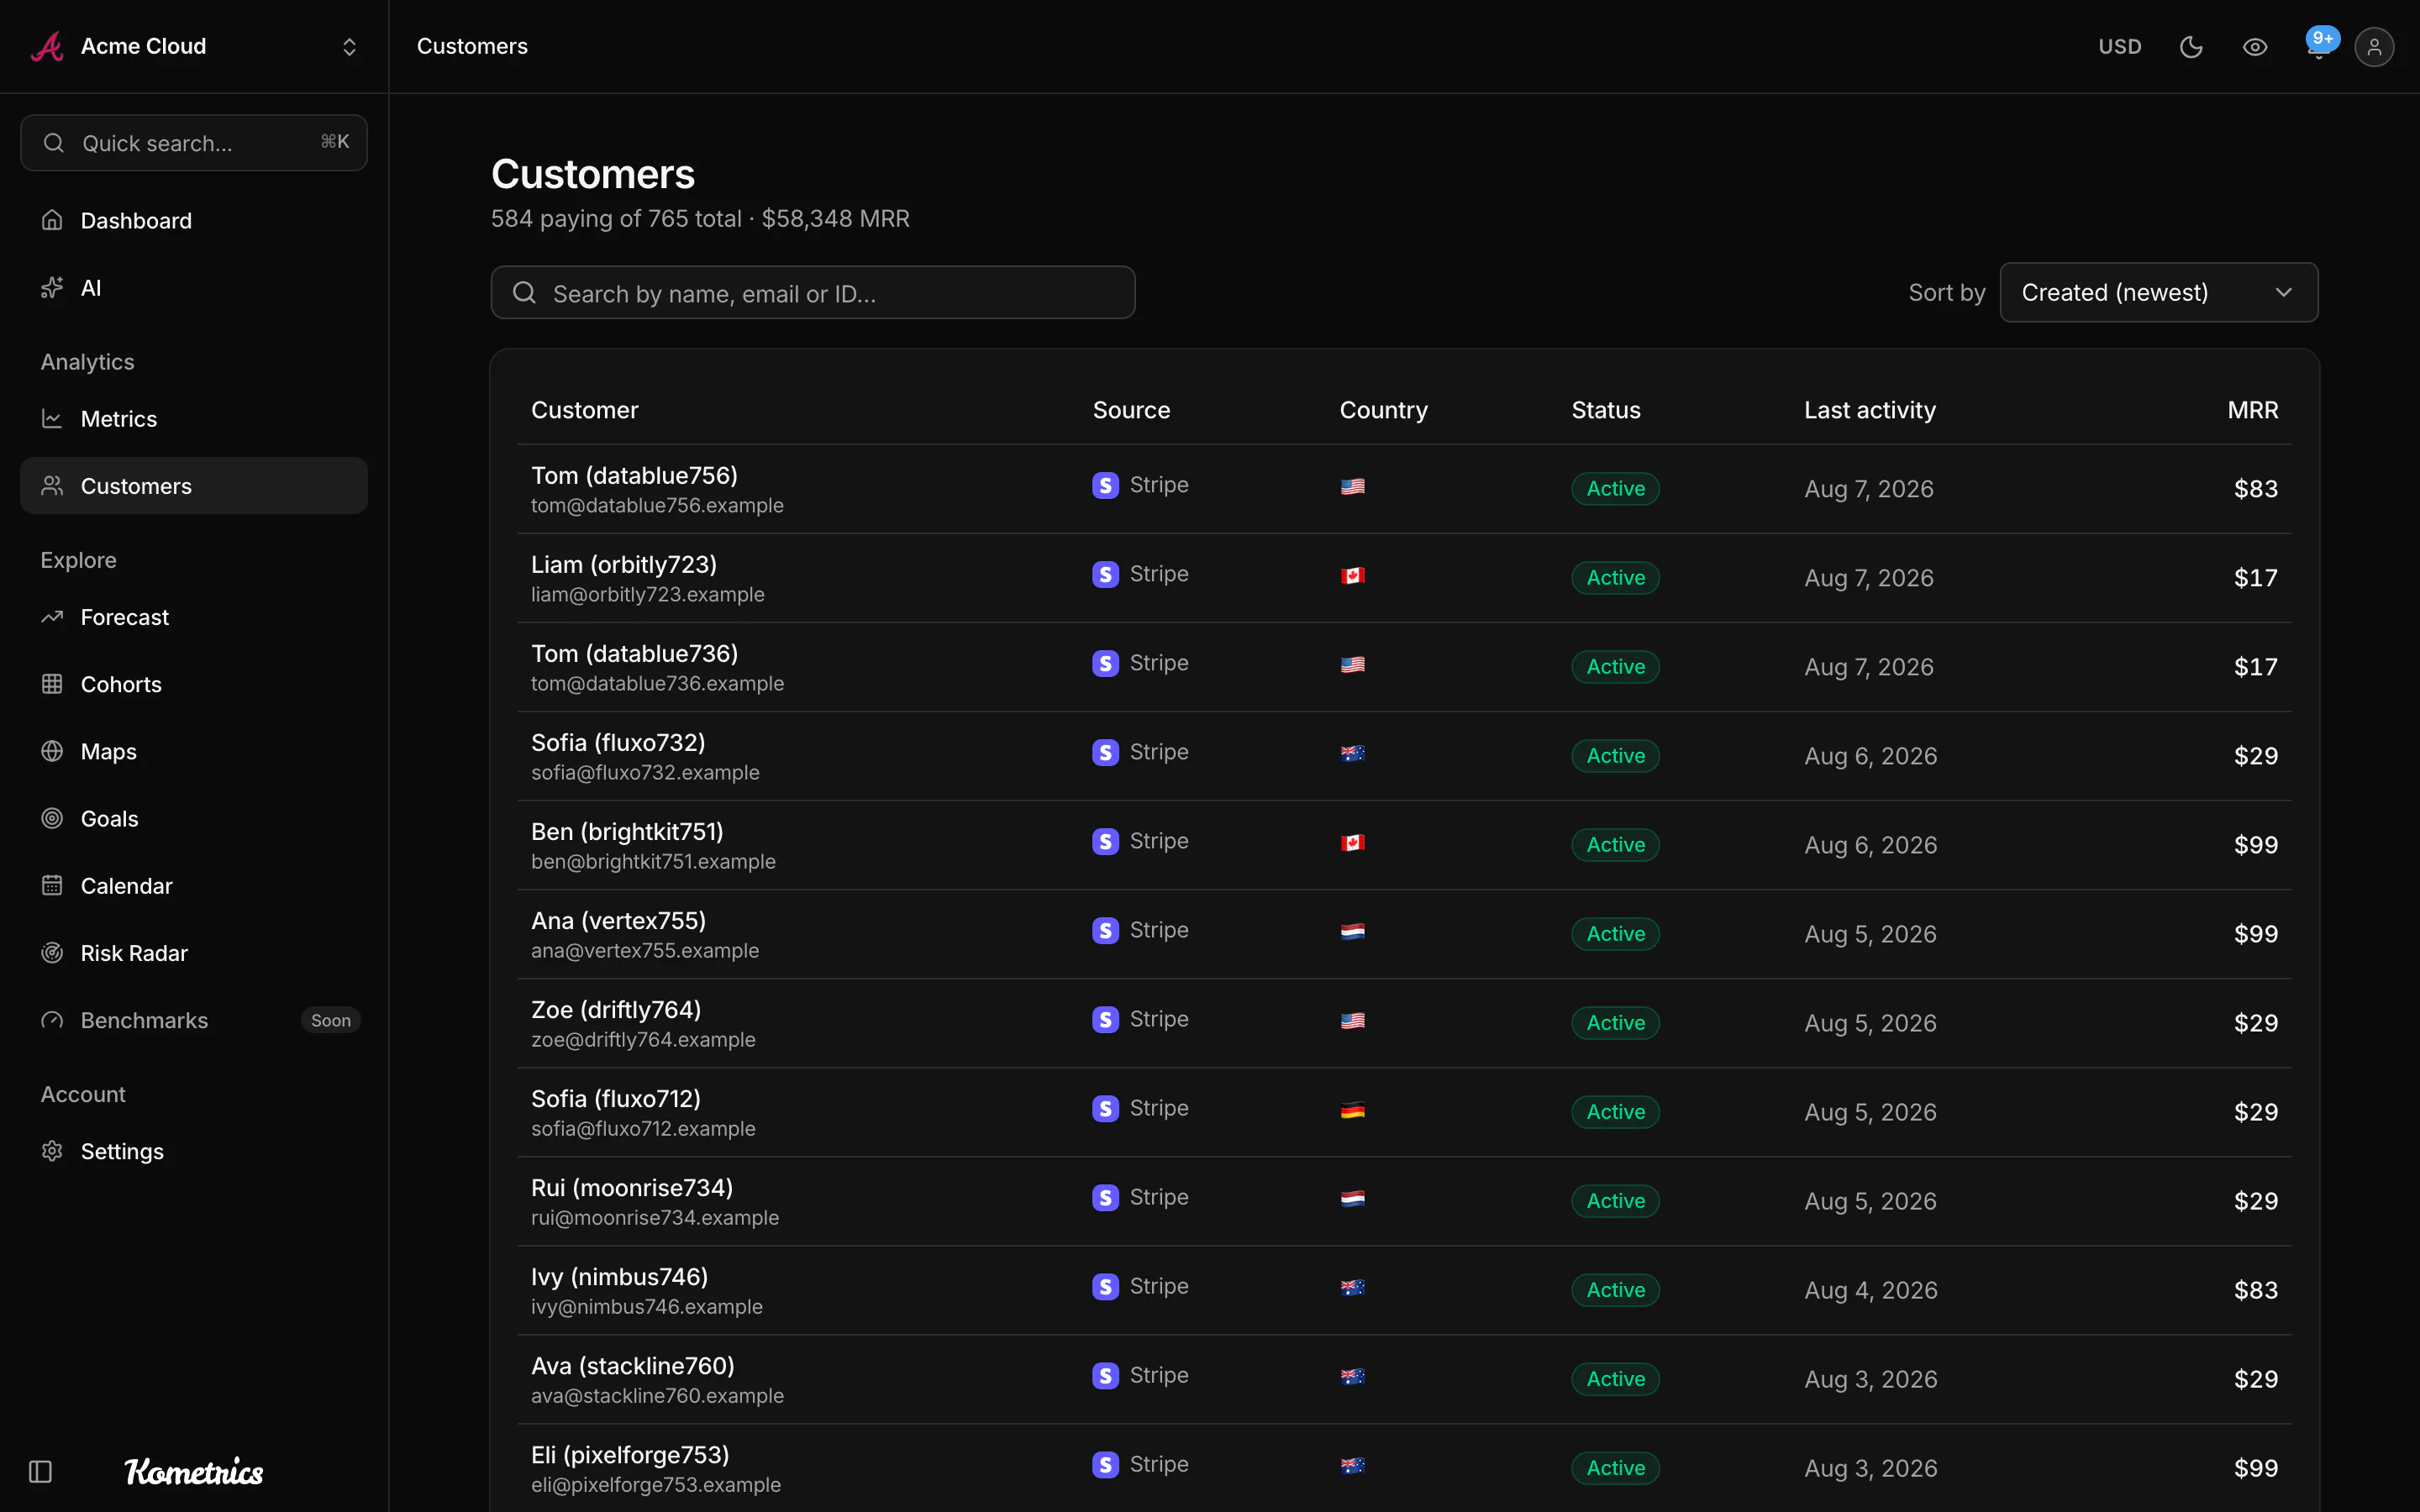
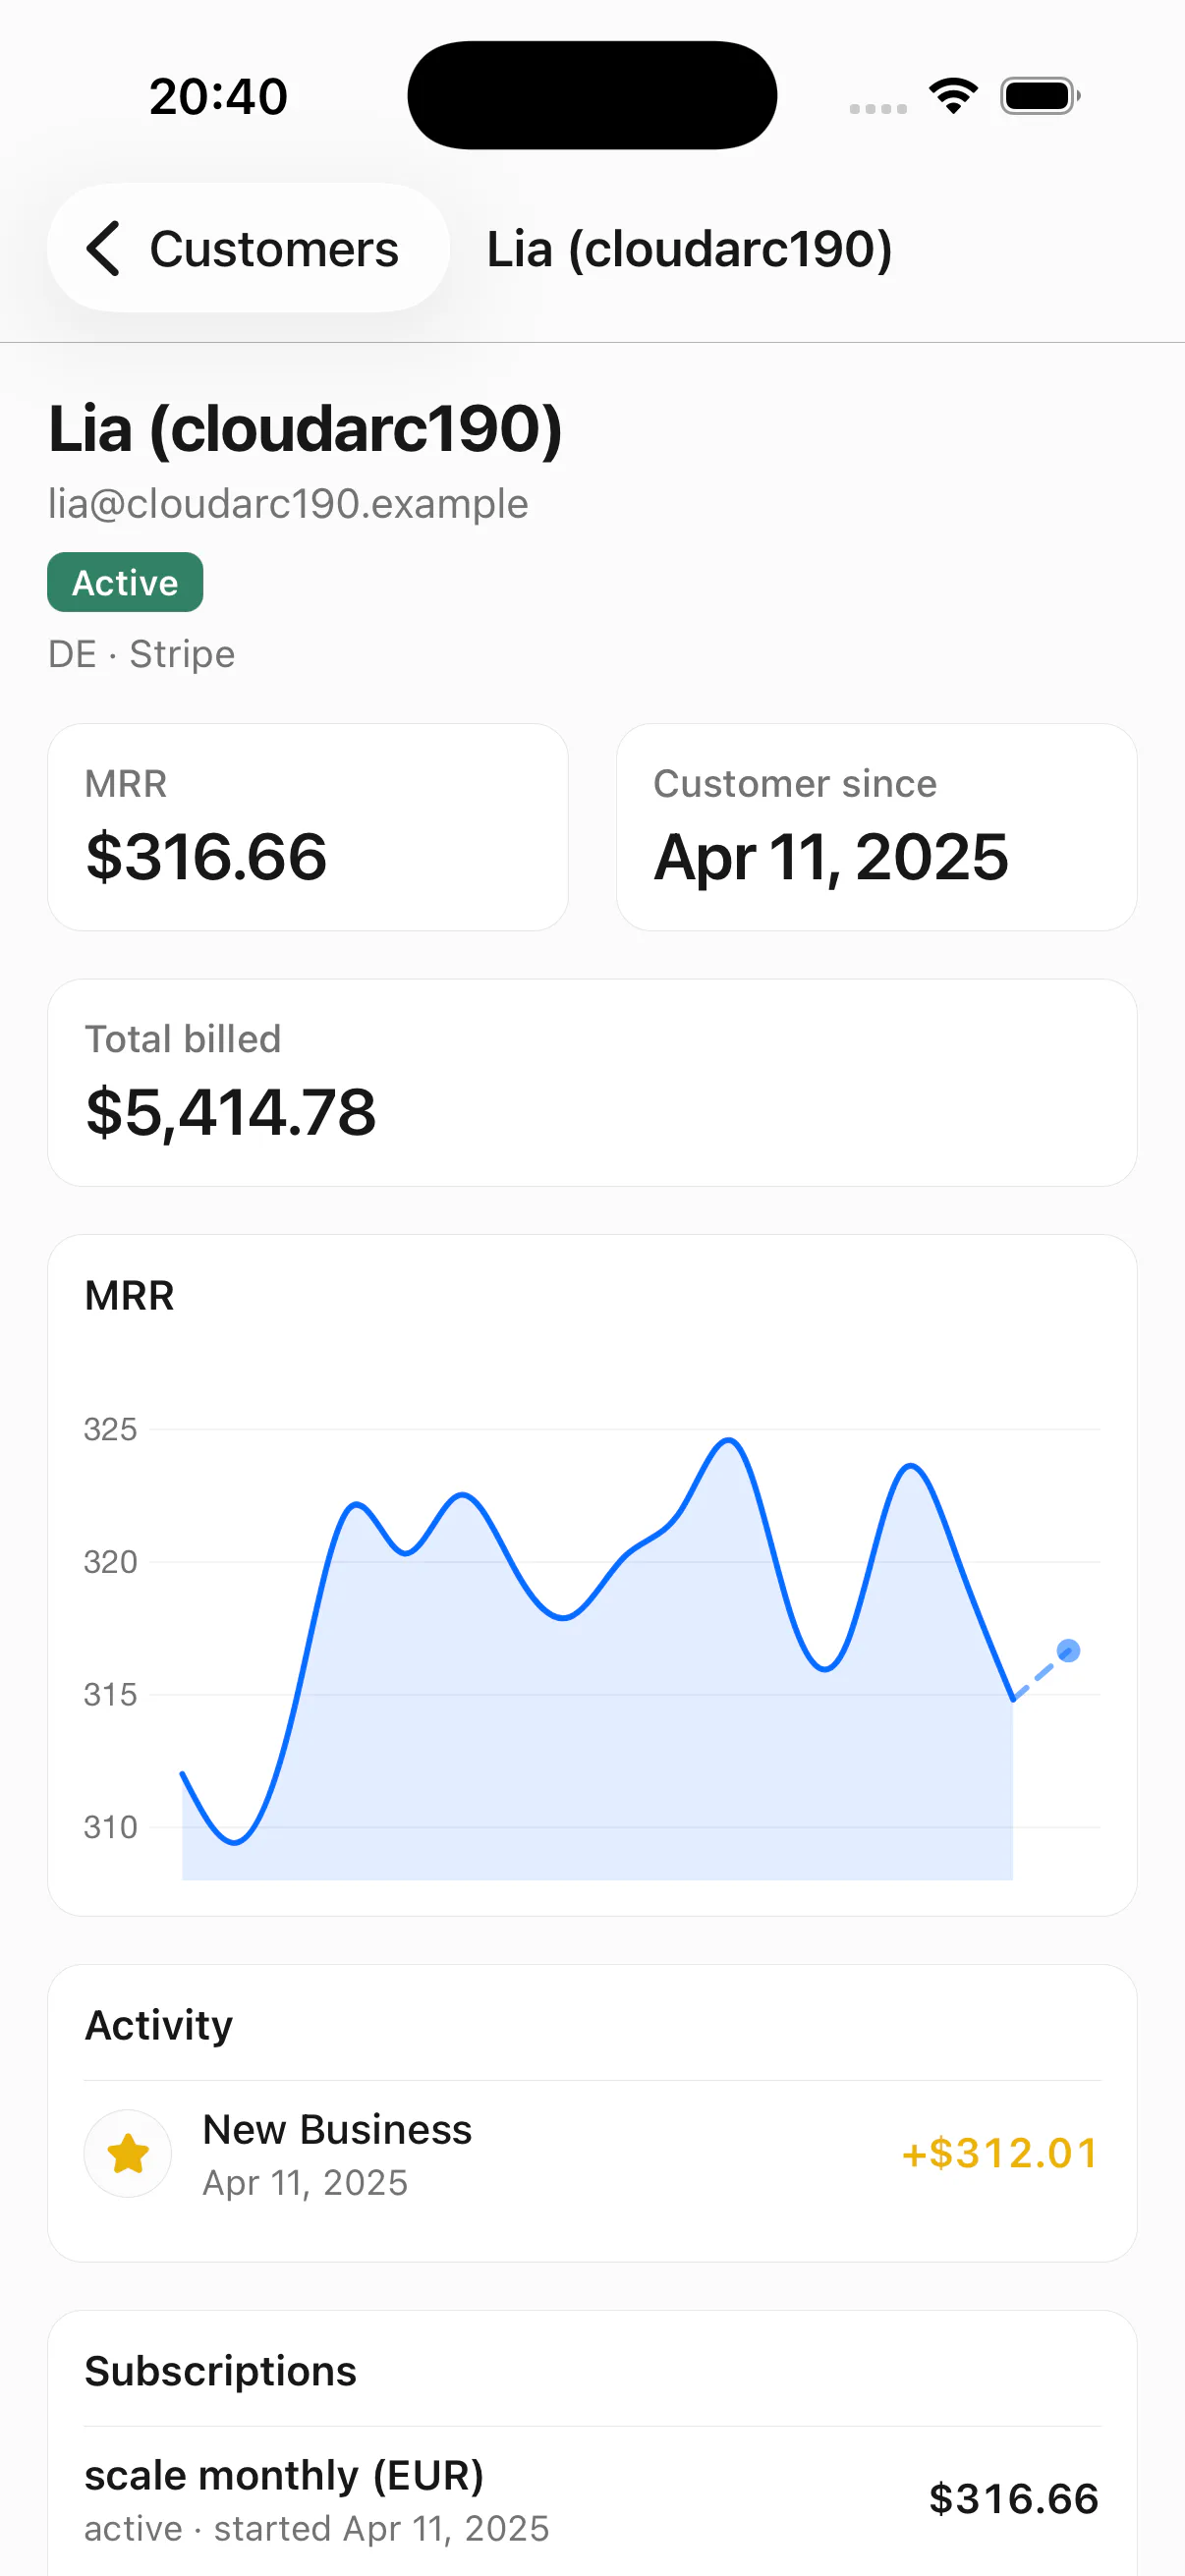
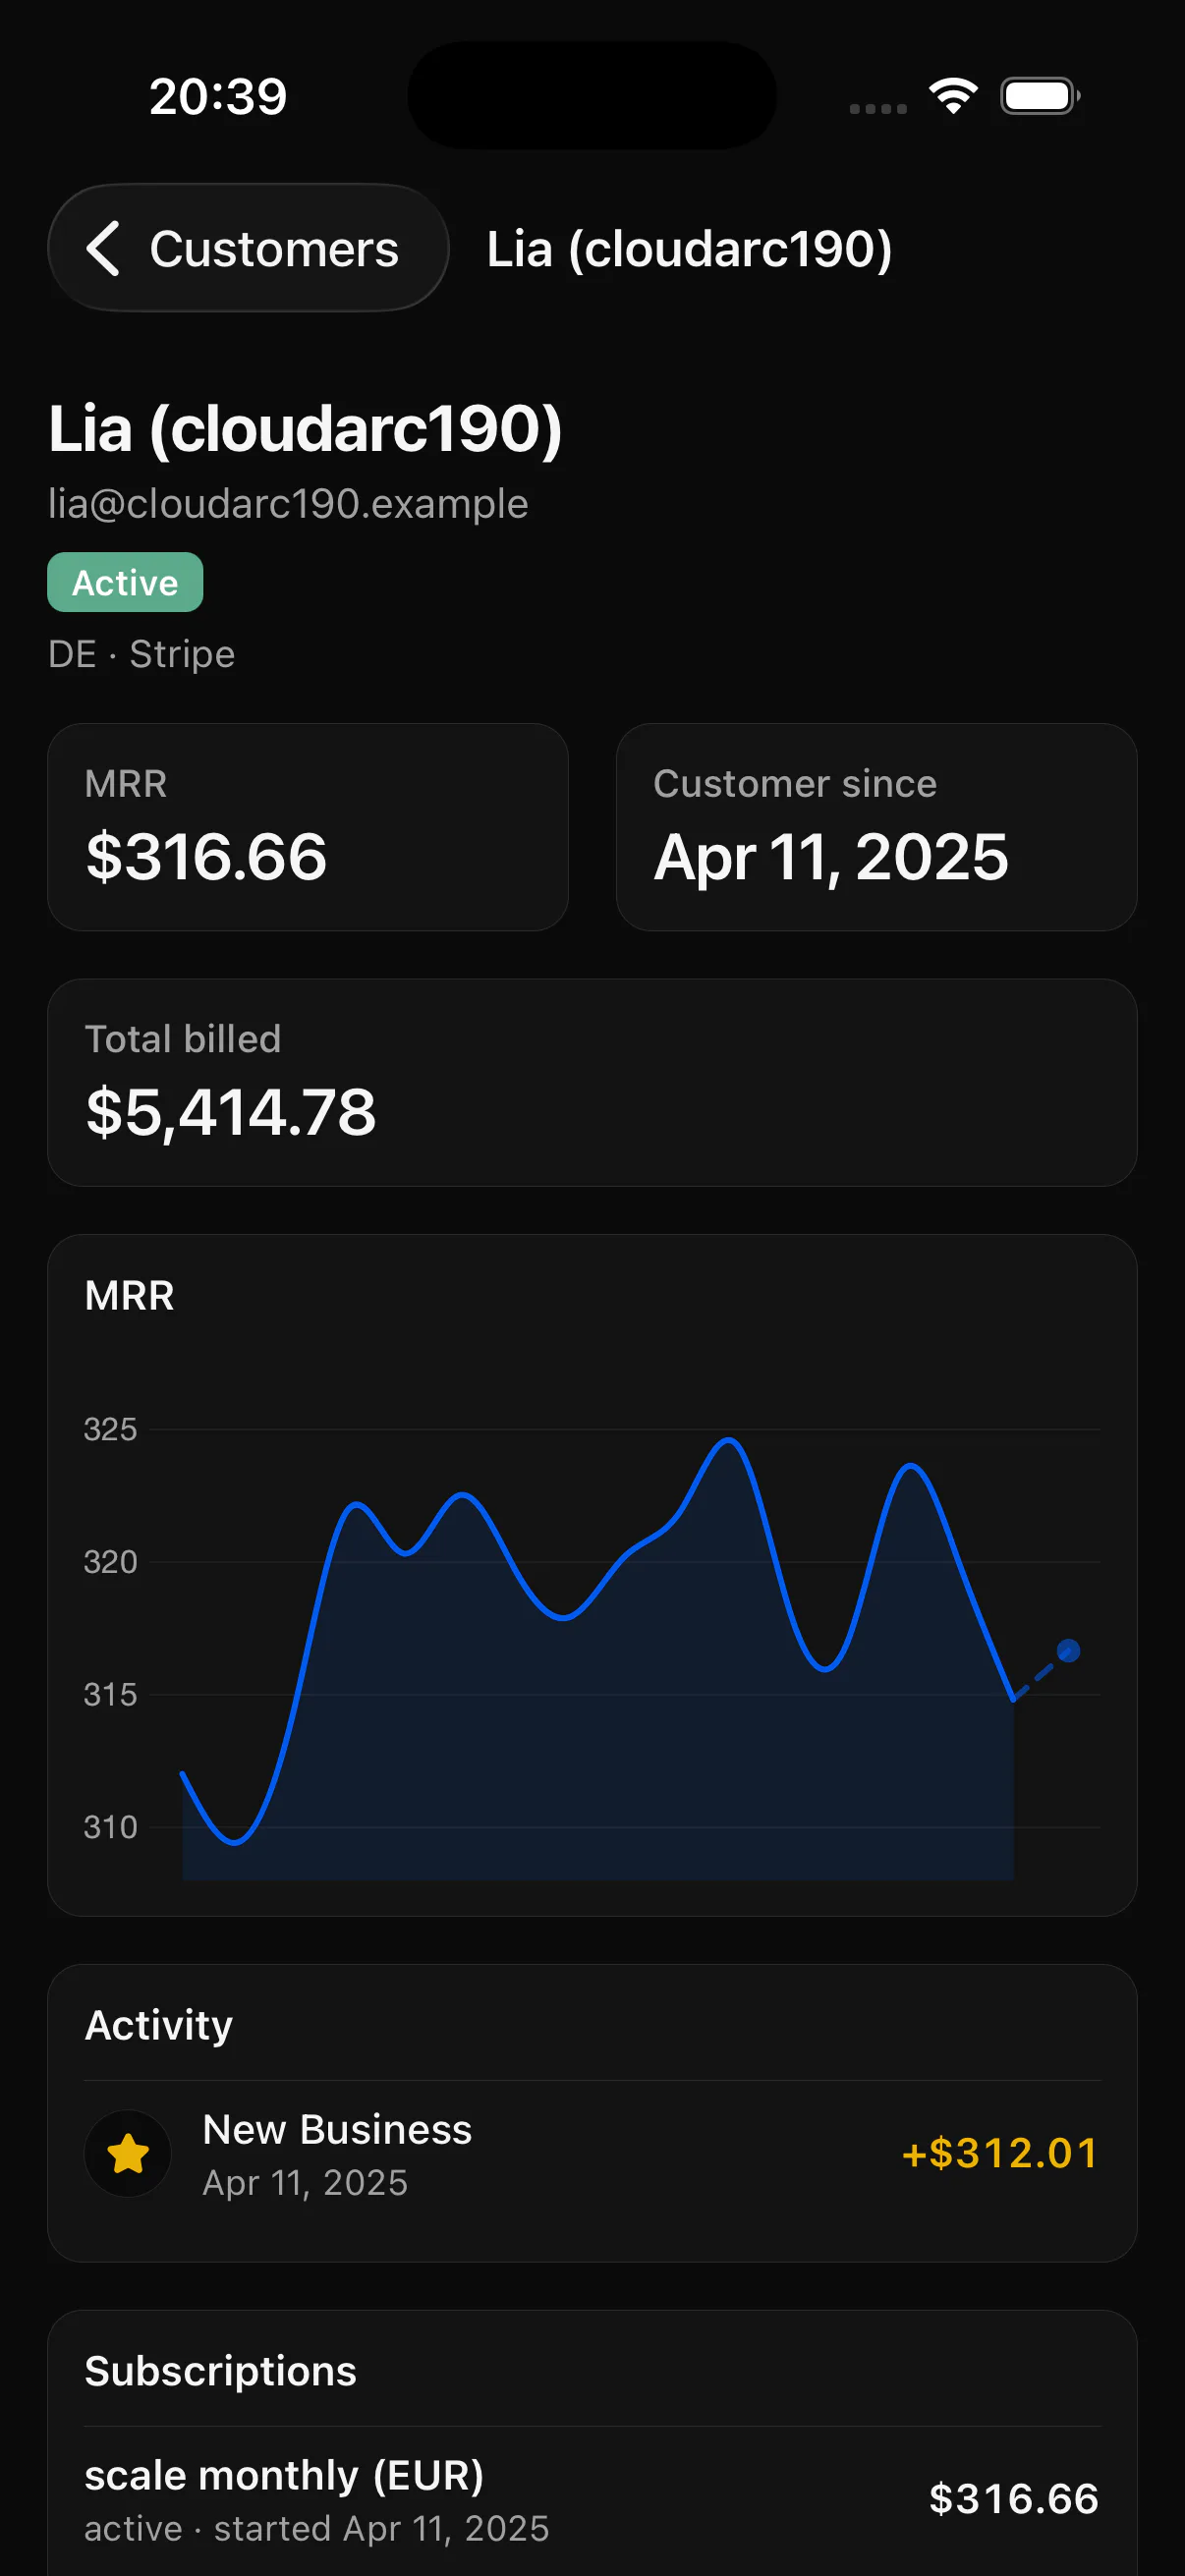
A metric is only trustworthy if you can open it. Each customer carries their MRR history, subscriptions, movements and invoices, so a surprising month turns into a list of names instead of an argument about the chart. Customers in dunning are called out on their own, because money that is late is a different problem from money that is gone.
- Per-customer MRR, movements and invoices
- Past due surfaced before it becomes churn
- Reachable from any report cell, and from the API
Or ask from wherever you already work
Kometrics speaks the Model Context Protocol, so one URL puts the same tools inside Claude, ChatGPT, Claude Code or Codex. The client signs you in over OAuth, you pick the workspace it reads, and there is no key to paste.
https://app.kometrics.com/mcp- OAuth 2.1, so there is no key or secret to paste
- You choose which workspace each assistant reads
- Read only: no tool it exposes can write to your book
Your metrics on your phone screen
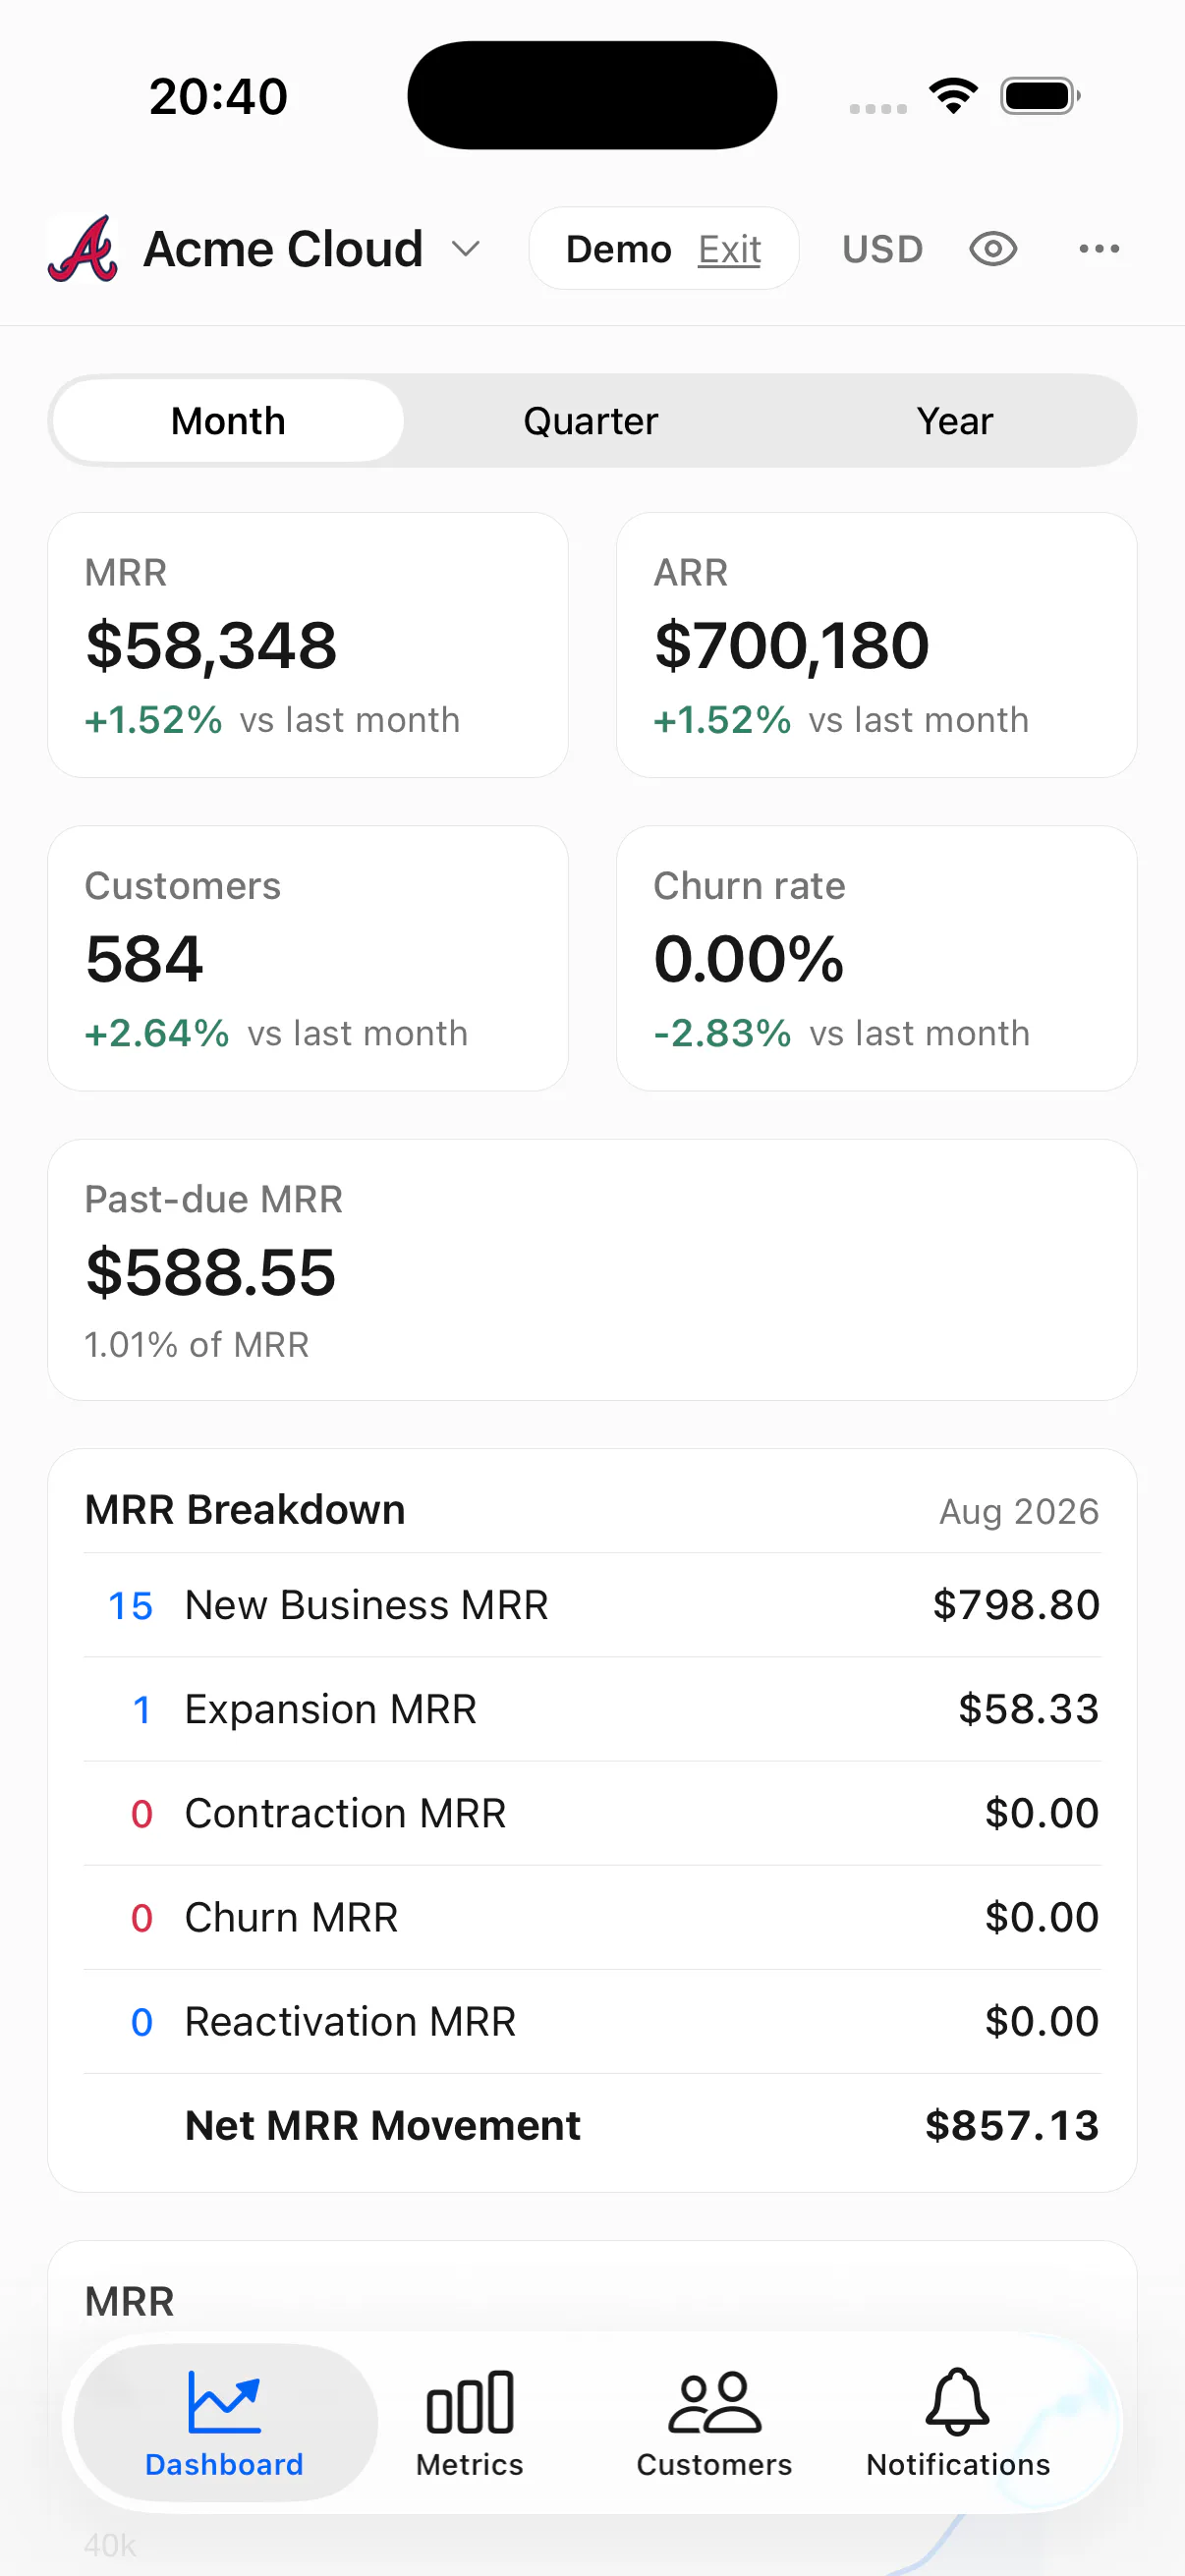
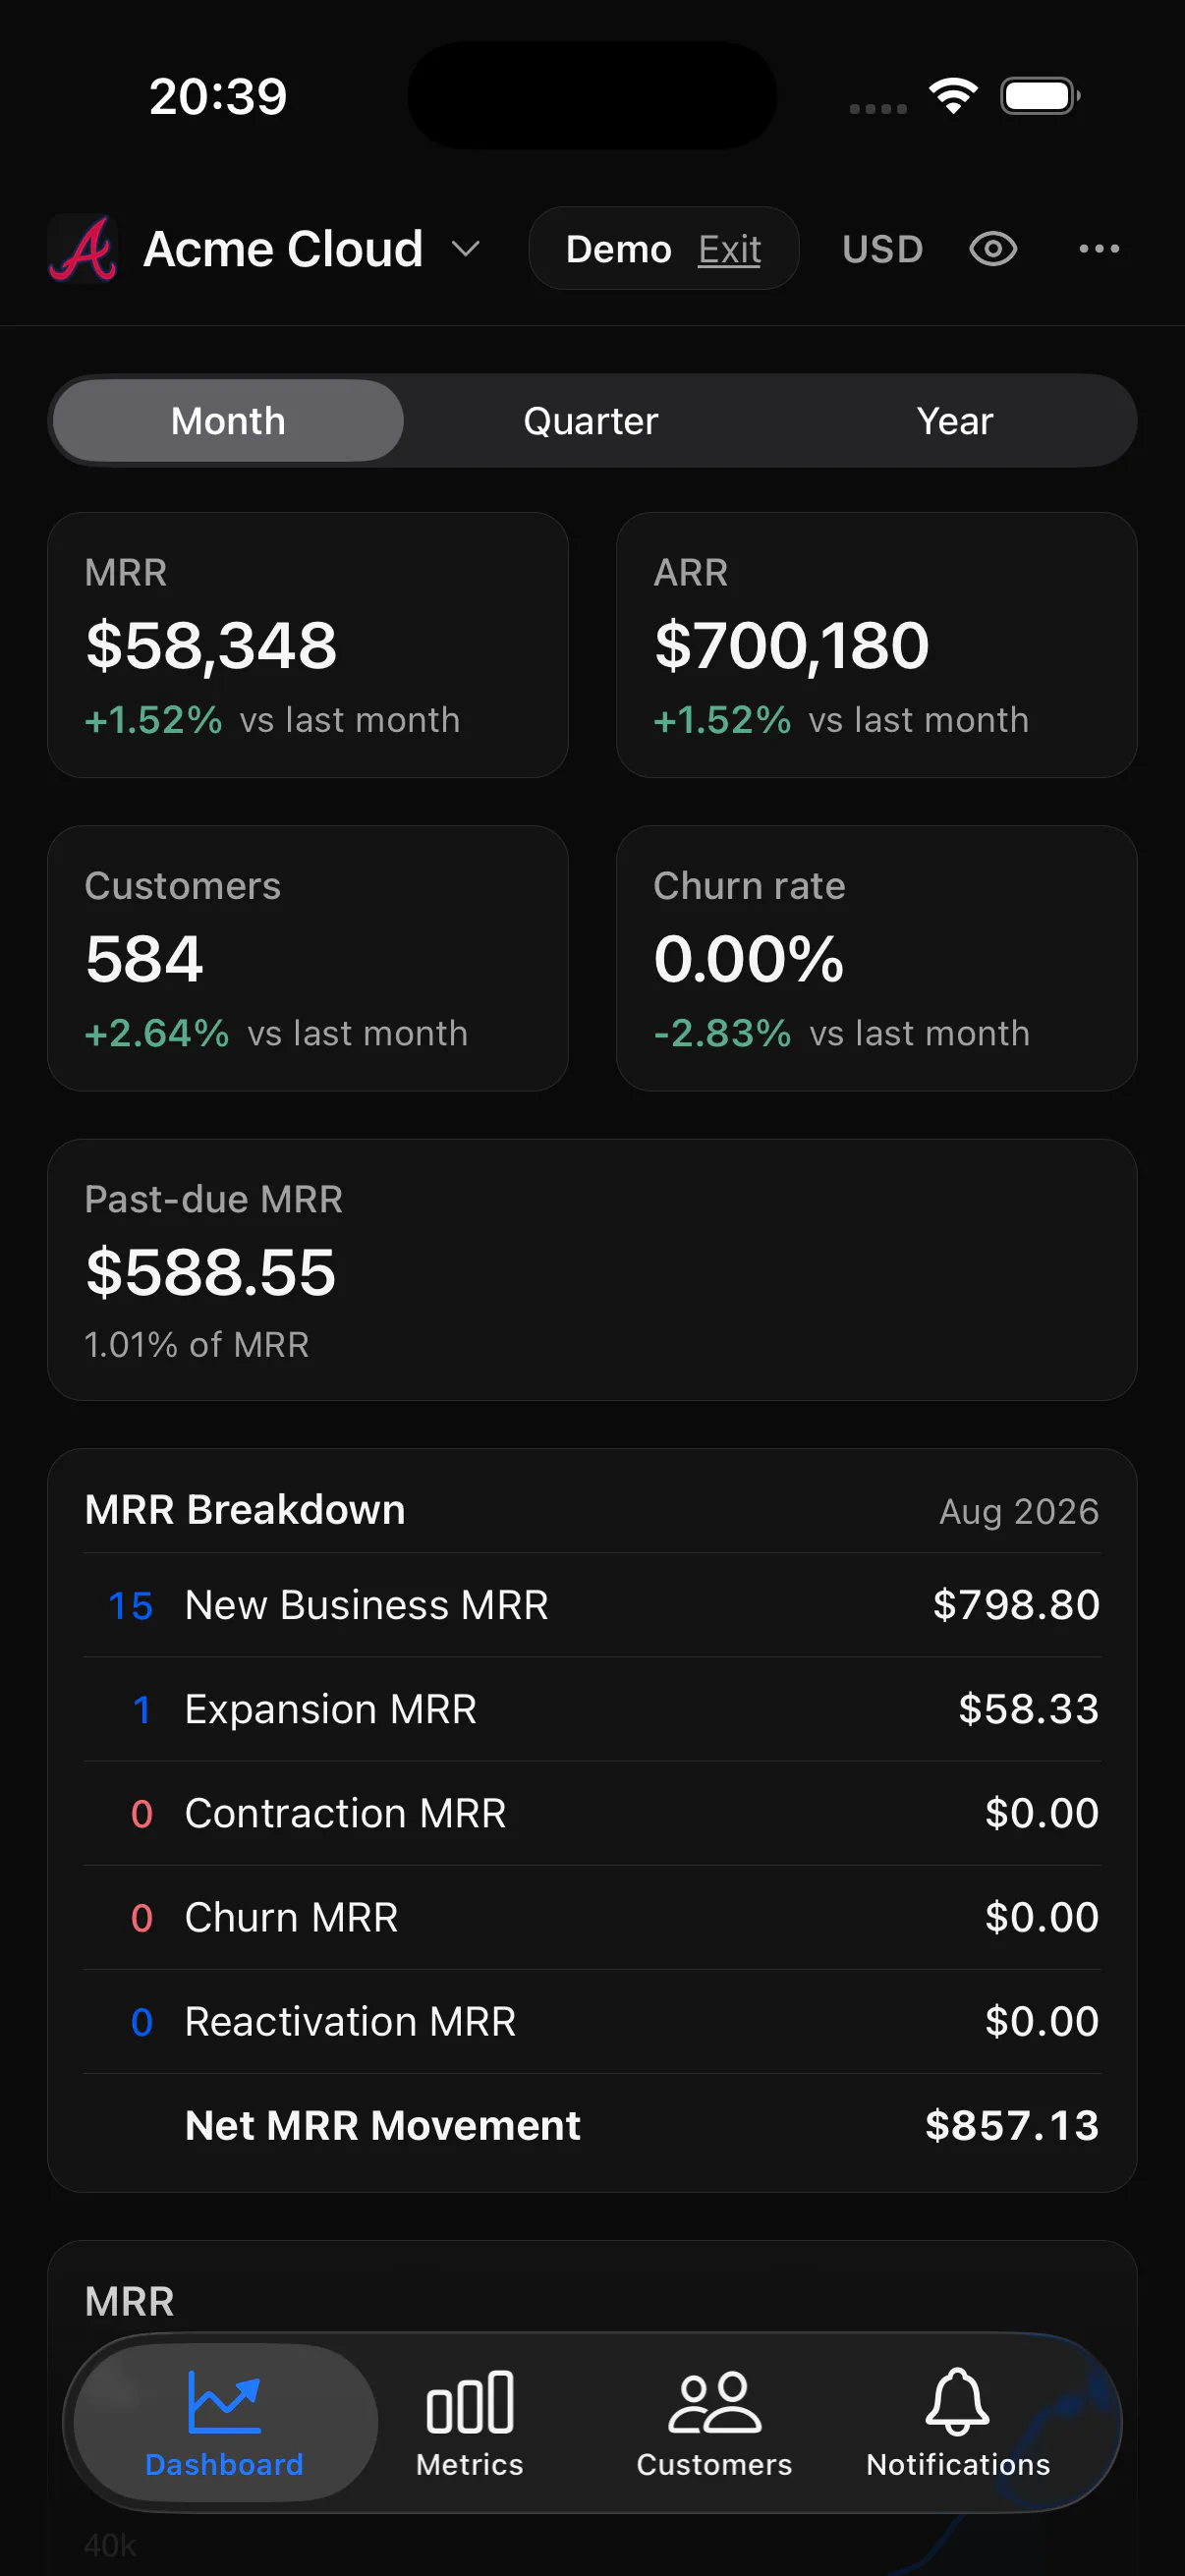
The whole book in your pocket, and the number you check first without even opening the app. Kometrics has an iOS app whose home and lock screen widgets keep this month MRR where you already look, next to the weather.
- Home and lock screen widgets with a sparkline
- The dashboard with this month's movement breakdown
- Any customer with their MRR charted
- The movements list behind every widget jump
Your metrics with a simple API
Everything the dashboard shows is served by a read-only REST API: metric series, customers, subscriptions and the full movements feed. Keys are scoped per workspace, stored hashed, and revocable in one click.
- API keys with an OpenAPI contract
- Signed webhooks keep the numbers current after the first sync
- Money as integer cents, so nothing drifts
curl -G https://api.kometrics.com/v1/metrics/mrr \
  -H "Authorization: Bearer ko_your_api_key" \
  -d start-date=2026-01-01 \
  -d end-date=2026-08-01 \
-d interval=month{
"entries": [
{ "date": "2026-01-31", "mrr": 4820000 }
],
"summary": { "current": 4820000, "percentage-change": 2.73 }
}Free until you pass $1,000 MRR
Then $15 a month billed yearly, or $19 month to month. One plan with everything in it, and a price that does not climb with your revenue.
See your own numbers in minutes
Paste a read-only key and the first sync pulls your entire history. If you would rather look before connecting anything, the demo is a full workspace with three years behind it.