

One screen that answers the morning question
MRR, movements and cash on one screen.
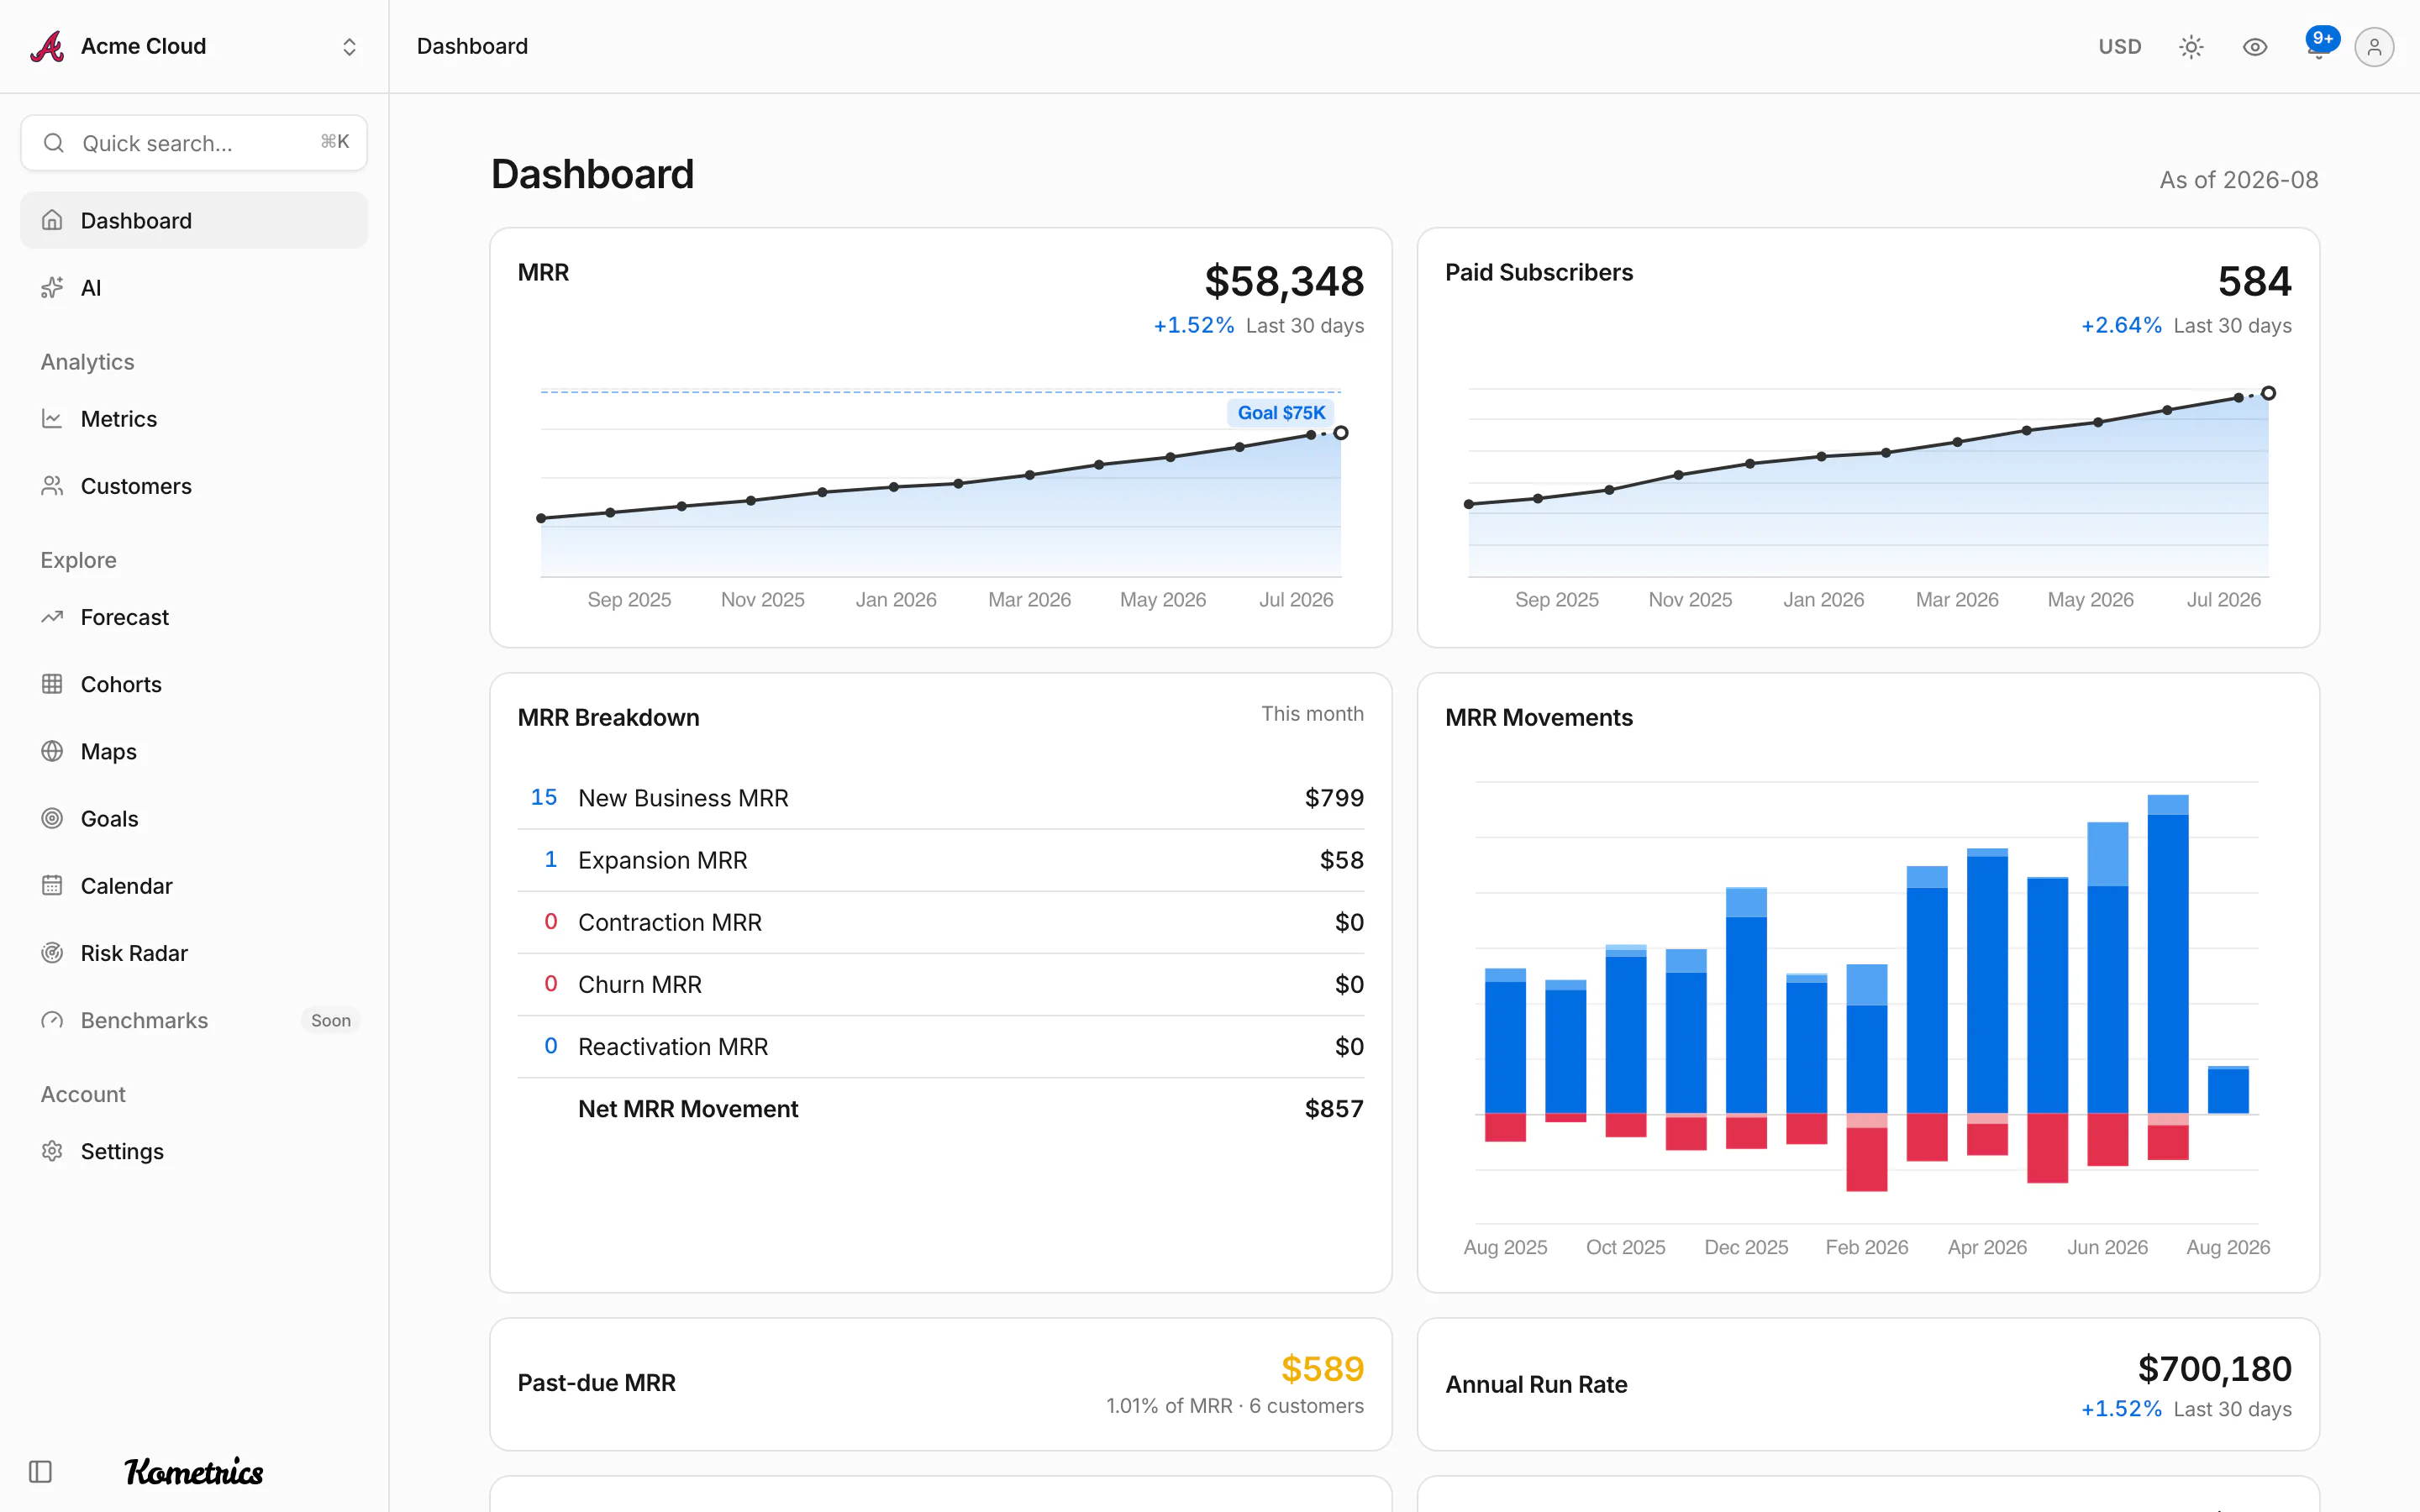
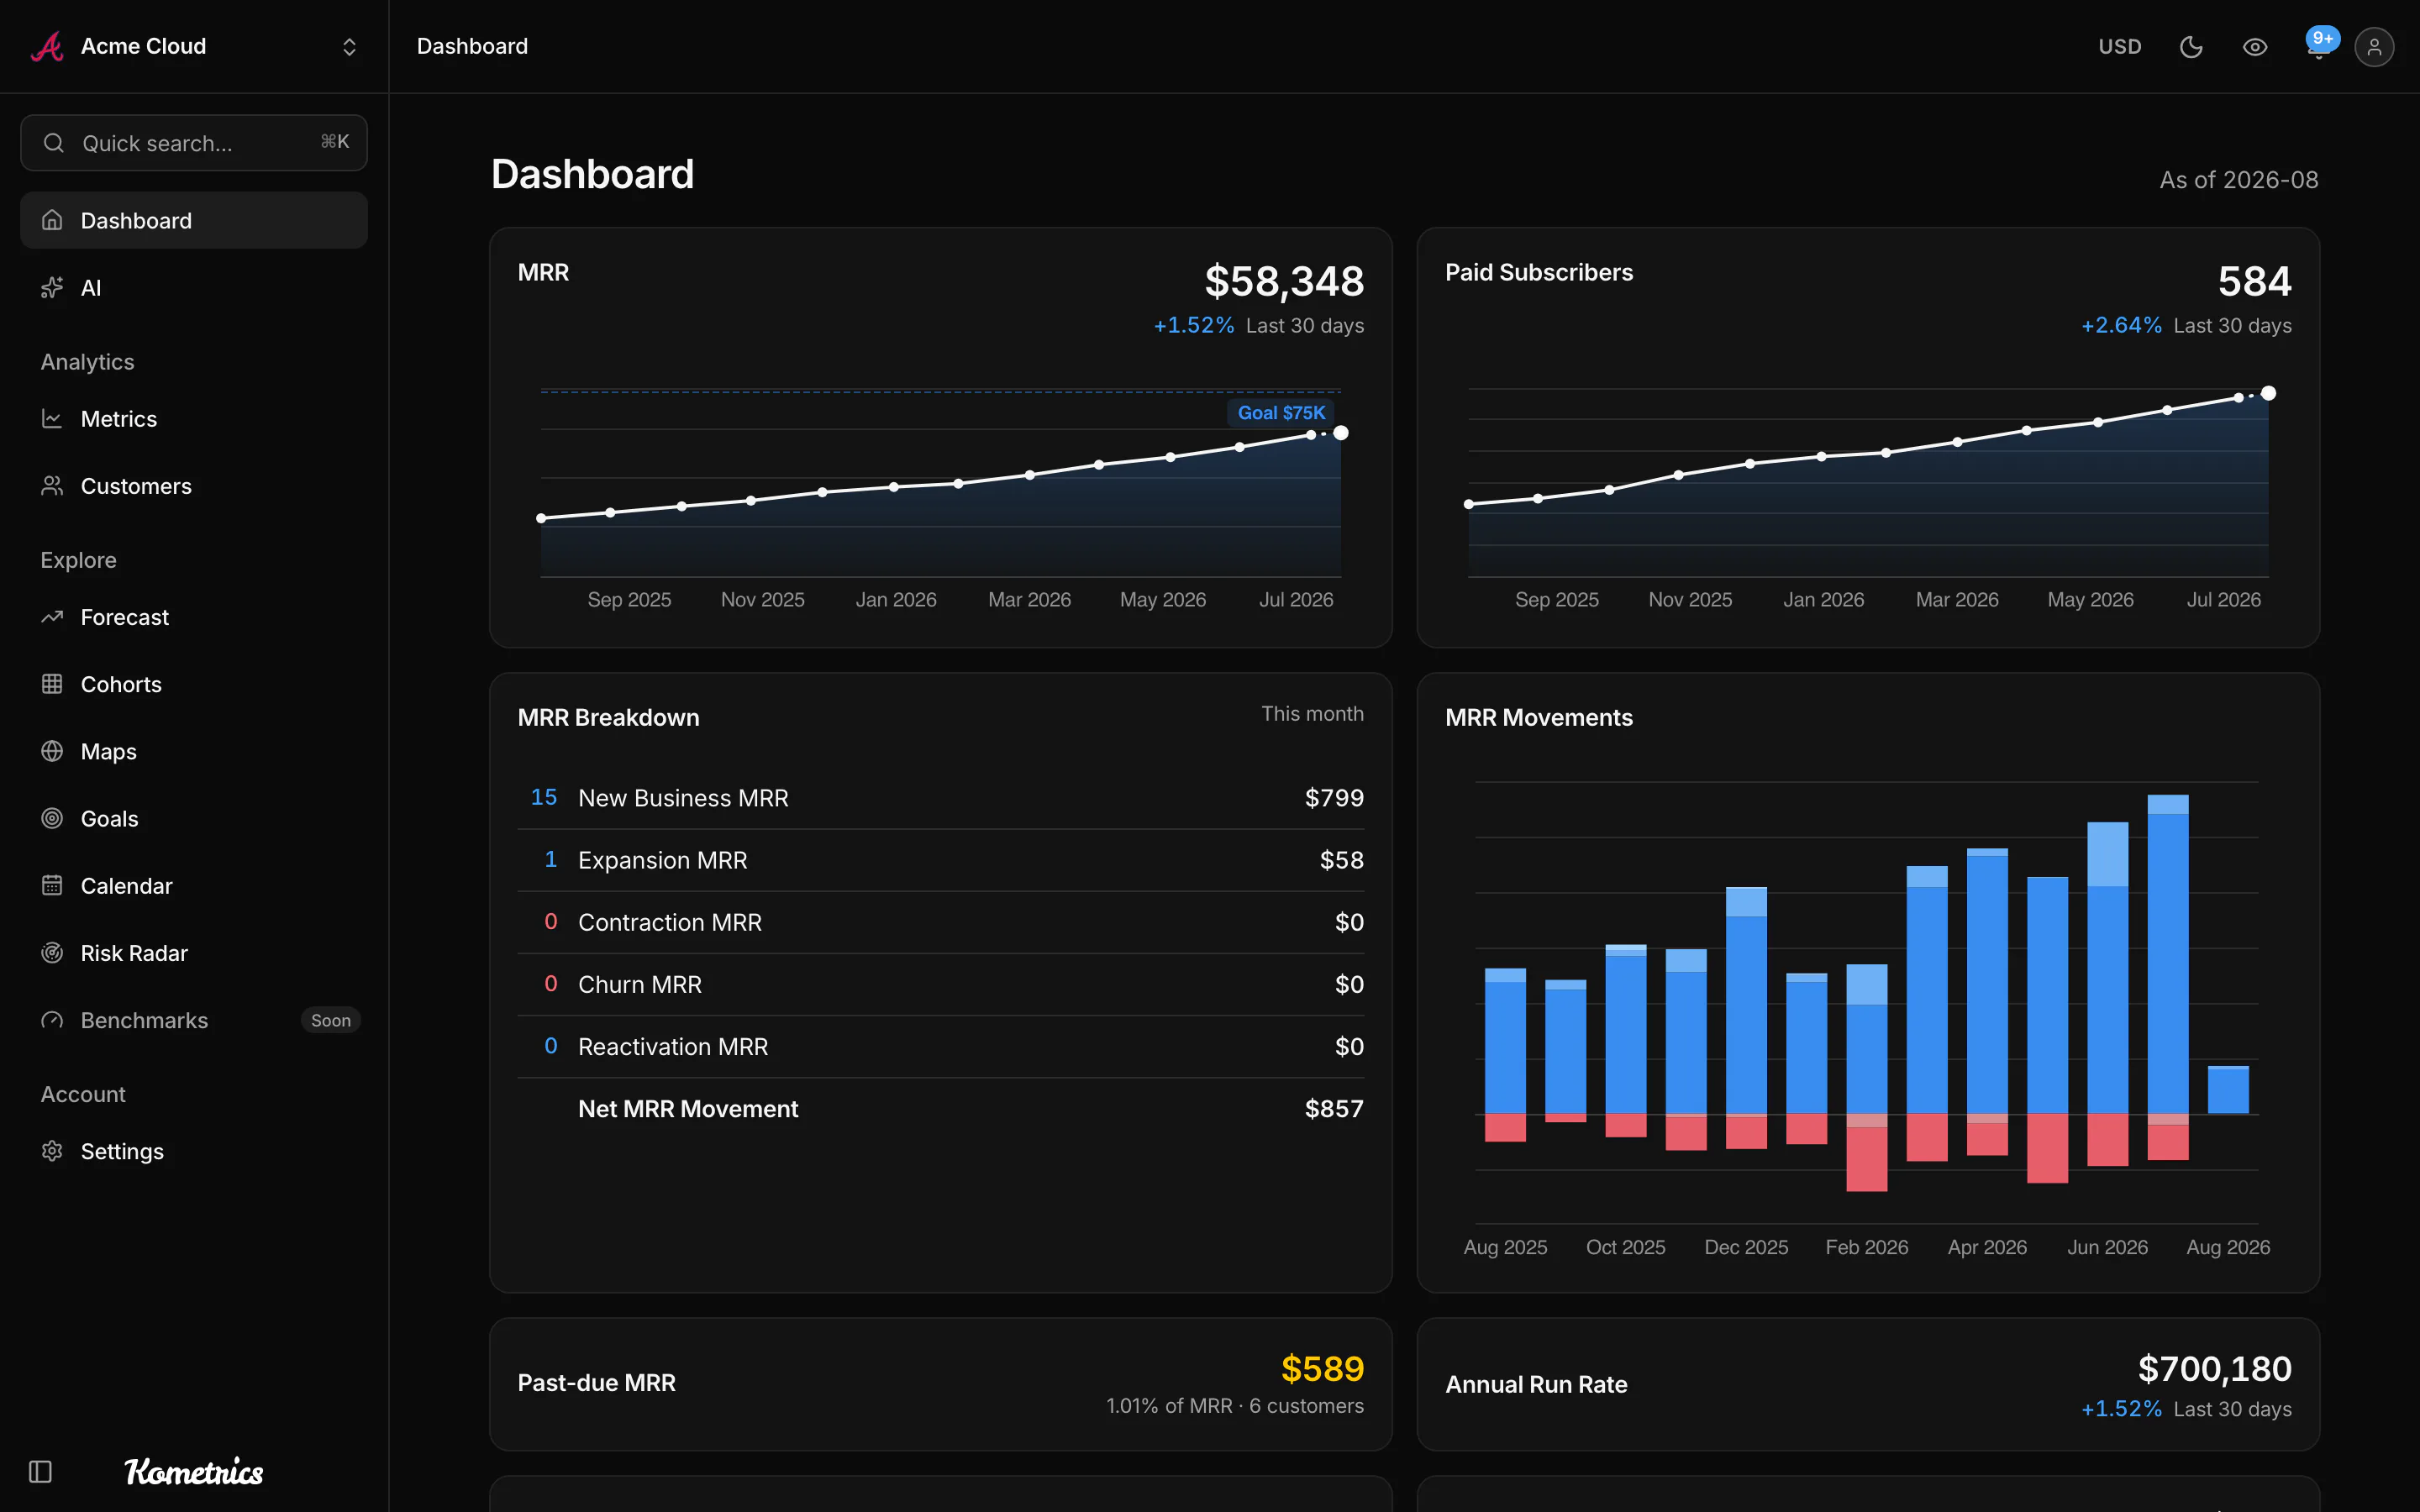
Most days the question is not which cohort retained best. It is whether the number went up, and why. The dashboard charts MRR and paid subscribers over the last thirteen months, with this month broken into new business, expansion, contraction, churn and reactivation beside them, so the answer and the reason share one screen.
Around the headline number, the vitals: annual run rate, ARPA, customer lifetime value and the three churn rates, each pinned to the last complete month so a half-collected month never reads as a collapse. Past-due MRR gets its own card with the customers behind it, because money that is late is a different problem from money that is gone.
Set an MRR goal and it is drawn straight onto the chart. Everything reads the same ledger the reports do, so the dashboard and the report pages can never quietly disagree.
What it does
- MRR and paid subscriber trends over the last 13 months, with the running month drawn as partial
- This month's movement breakdown: new business, expansion, contraction, churn and reactivation, with counts
- Past-due MRR as a share of the book, with the customers one click away
- ARR, ARPA, LTV and churn rates on the same screen, and your MRR goal on the chart
Connect your billing and see your own numbers
Free until your book passes $1,000 in MRR. A read-only key is all it takes to start, and the first sync pulls your whole history.