

Every report, and the math behind it
Subscription reports that agree with each other, down to the cent.
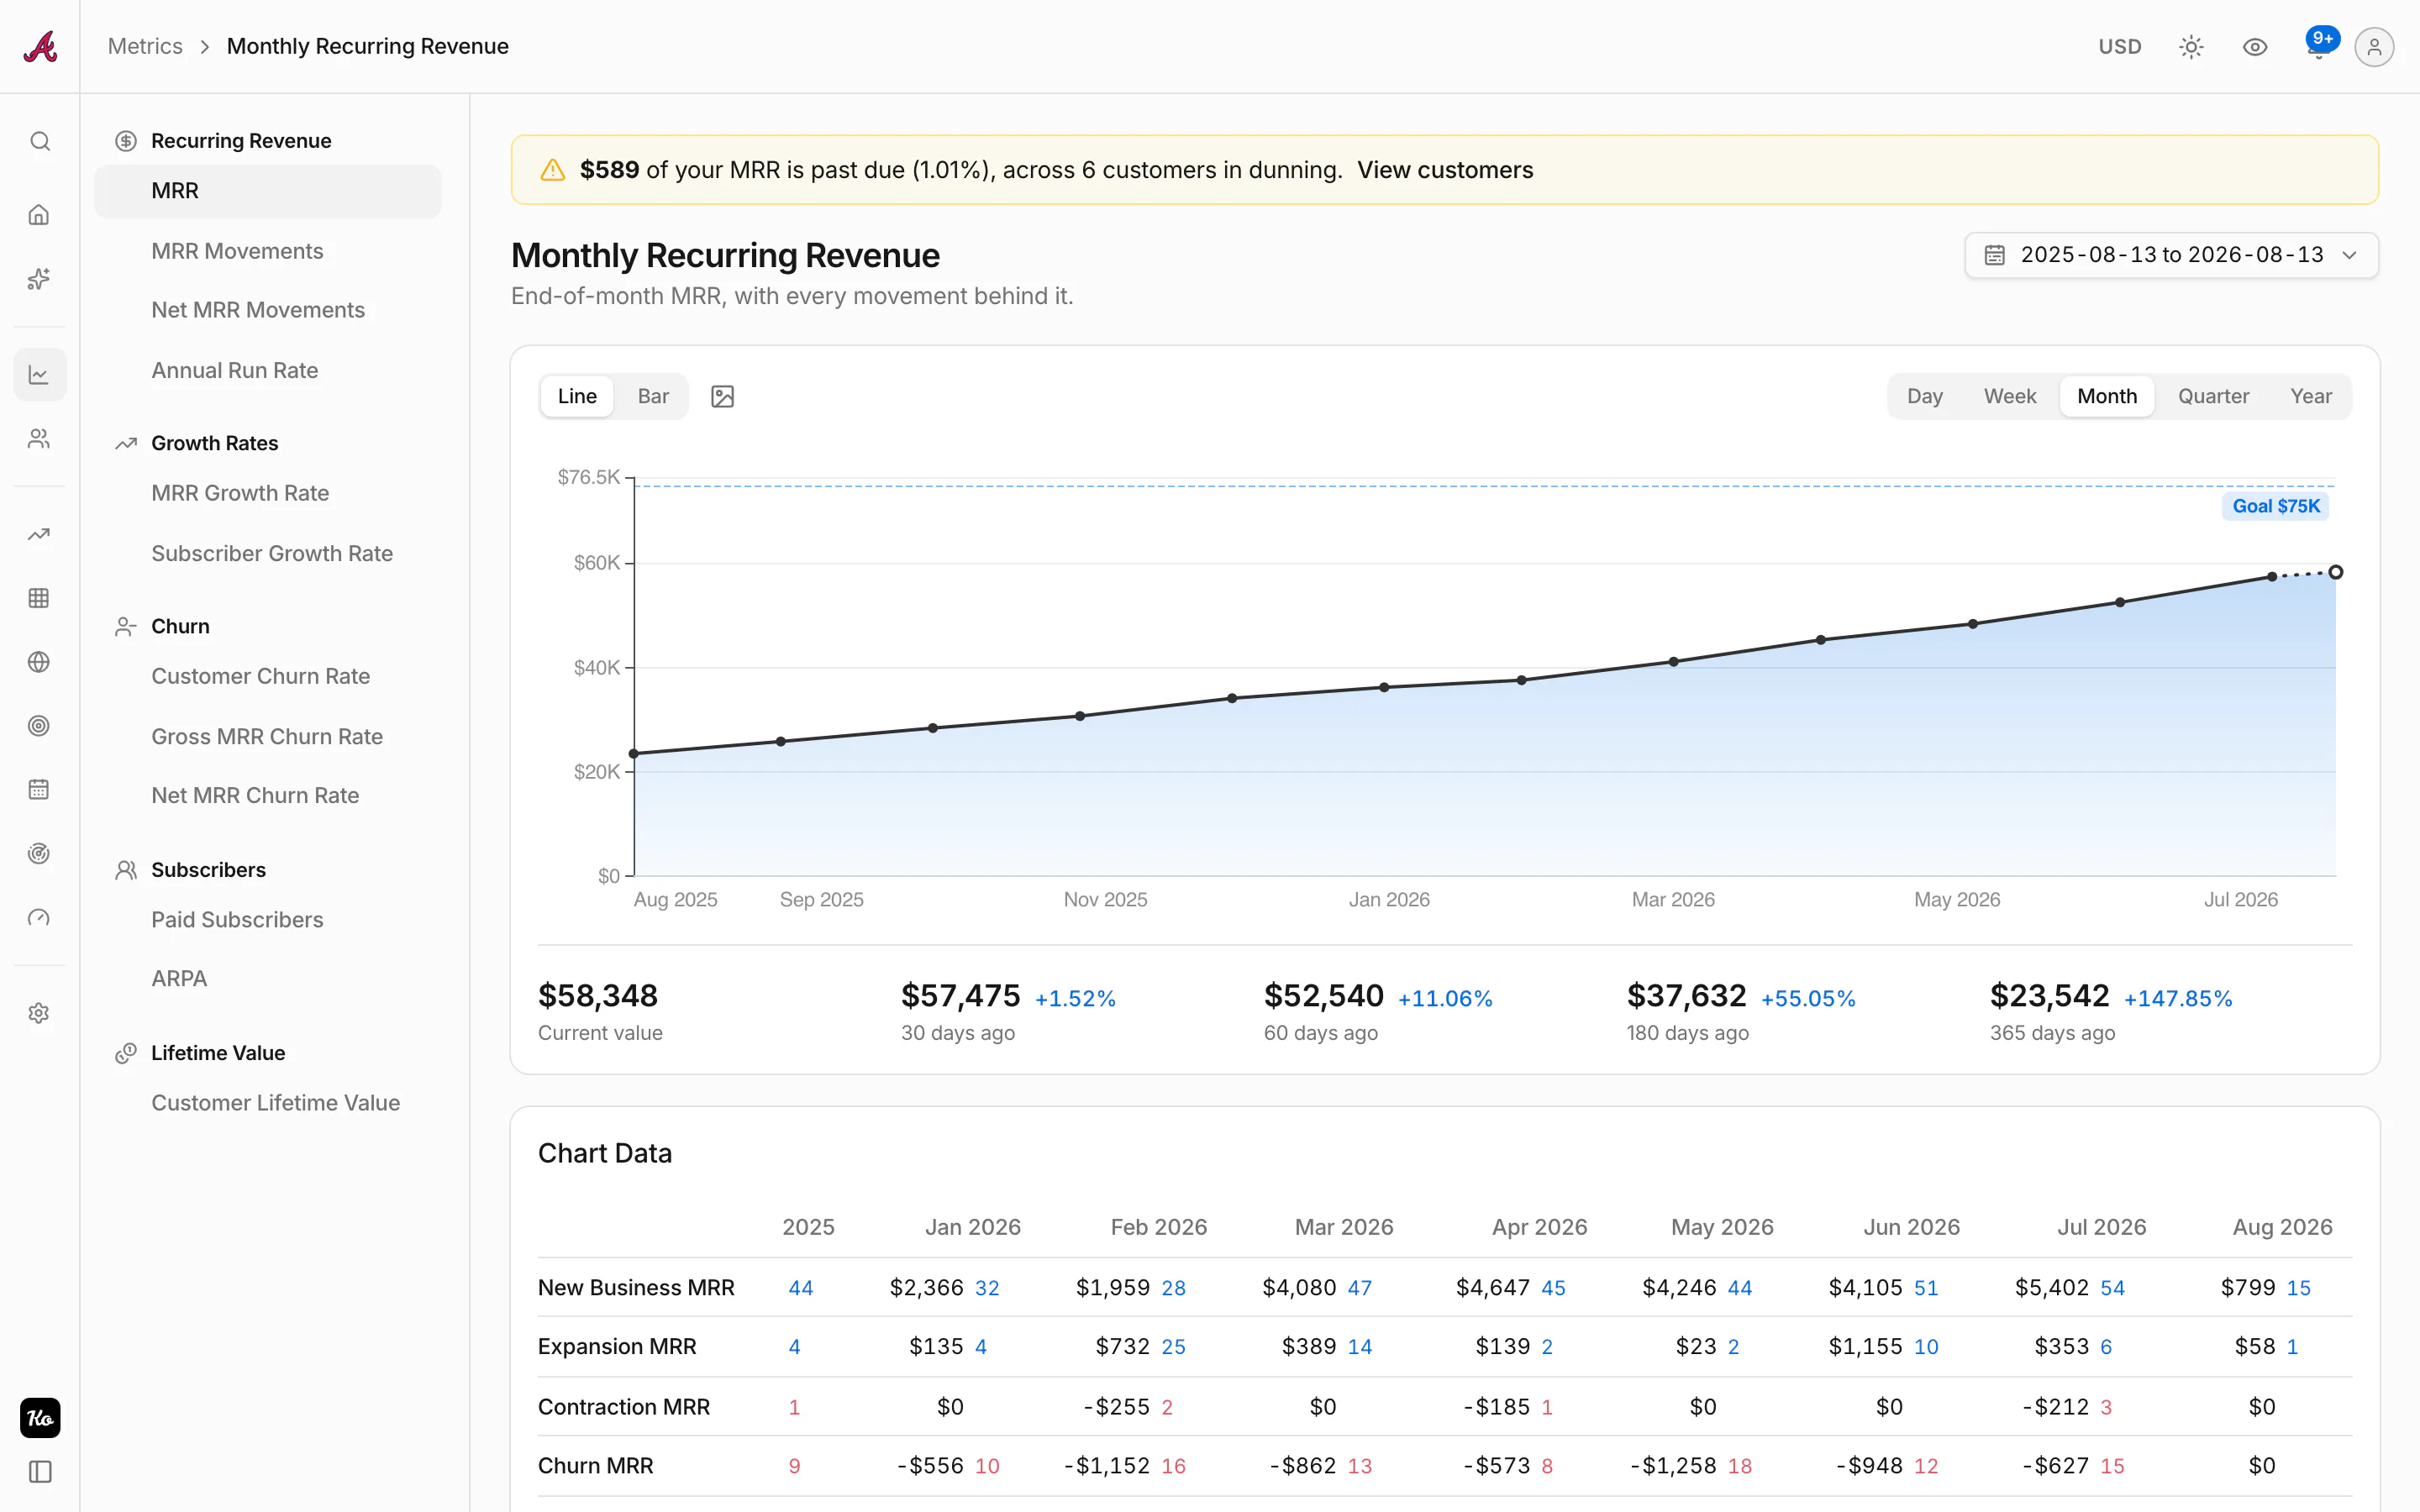
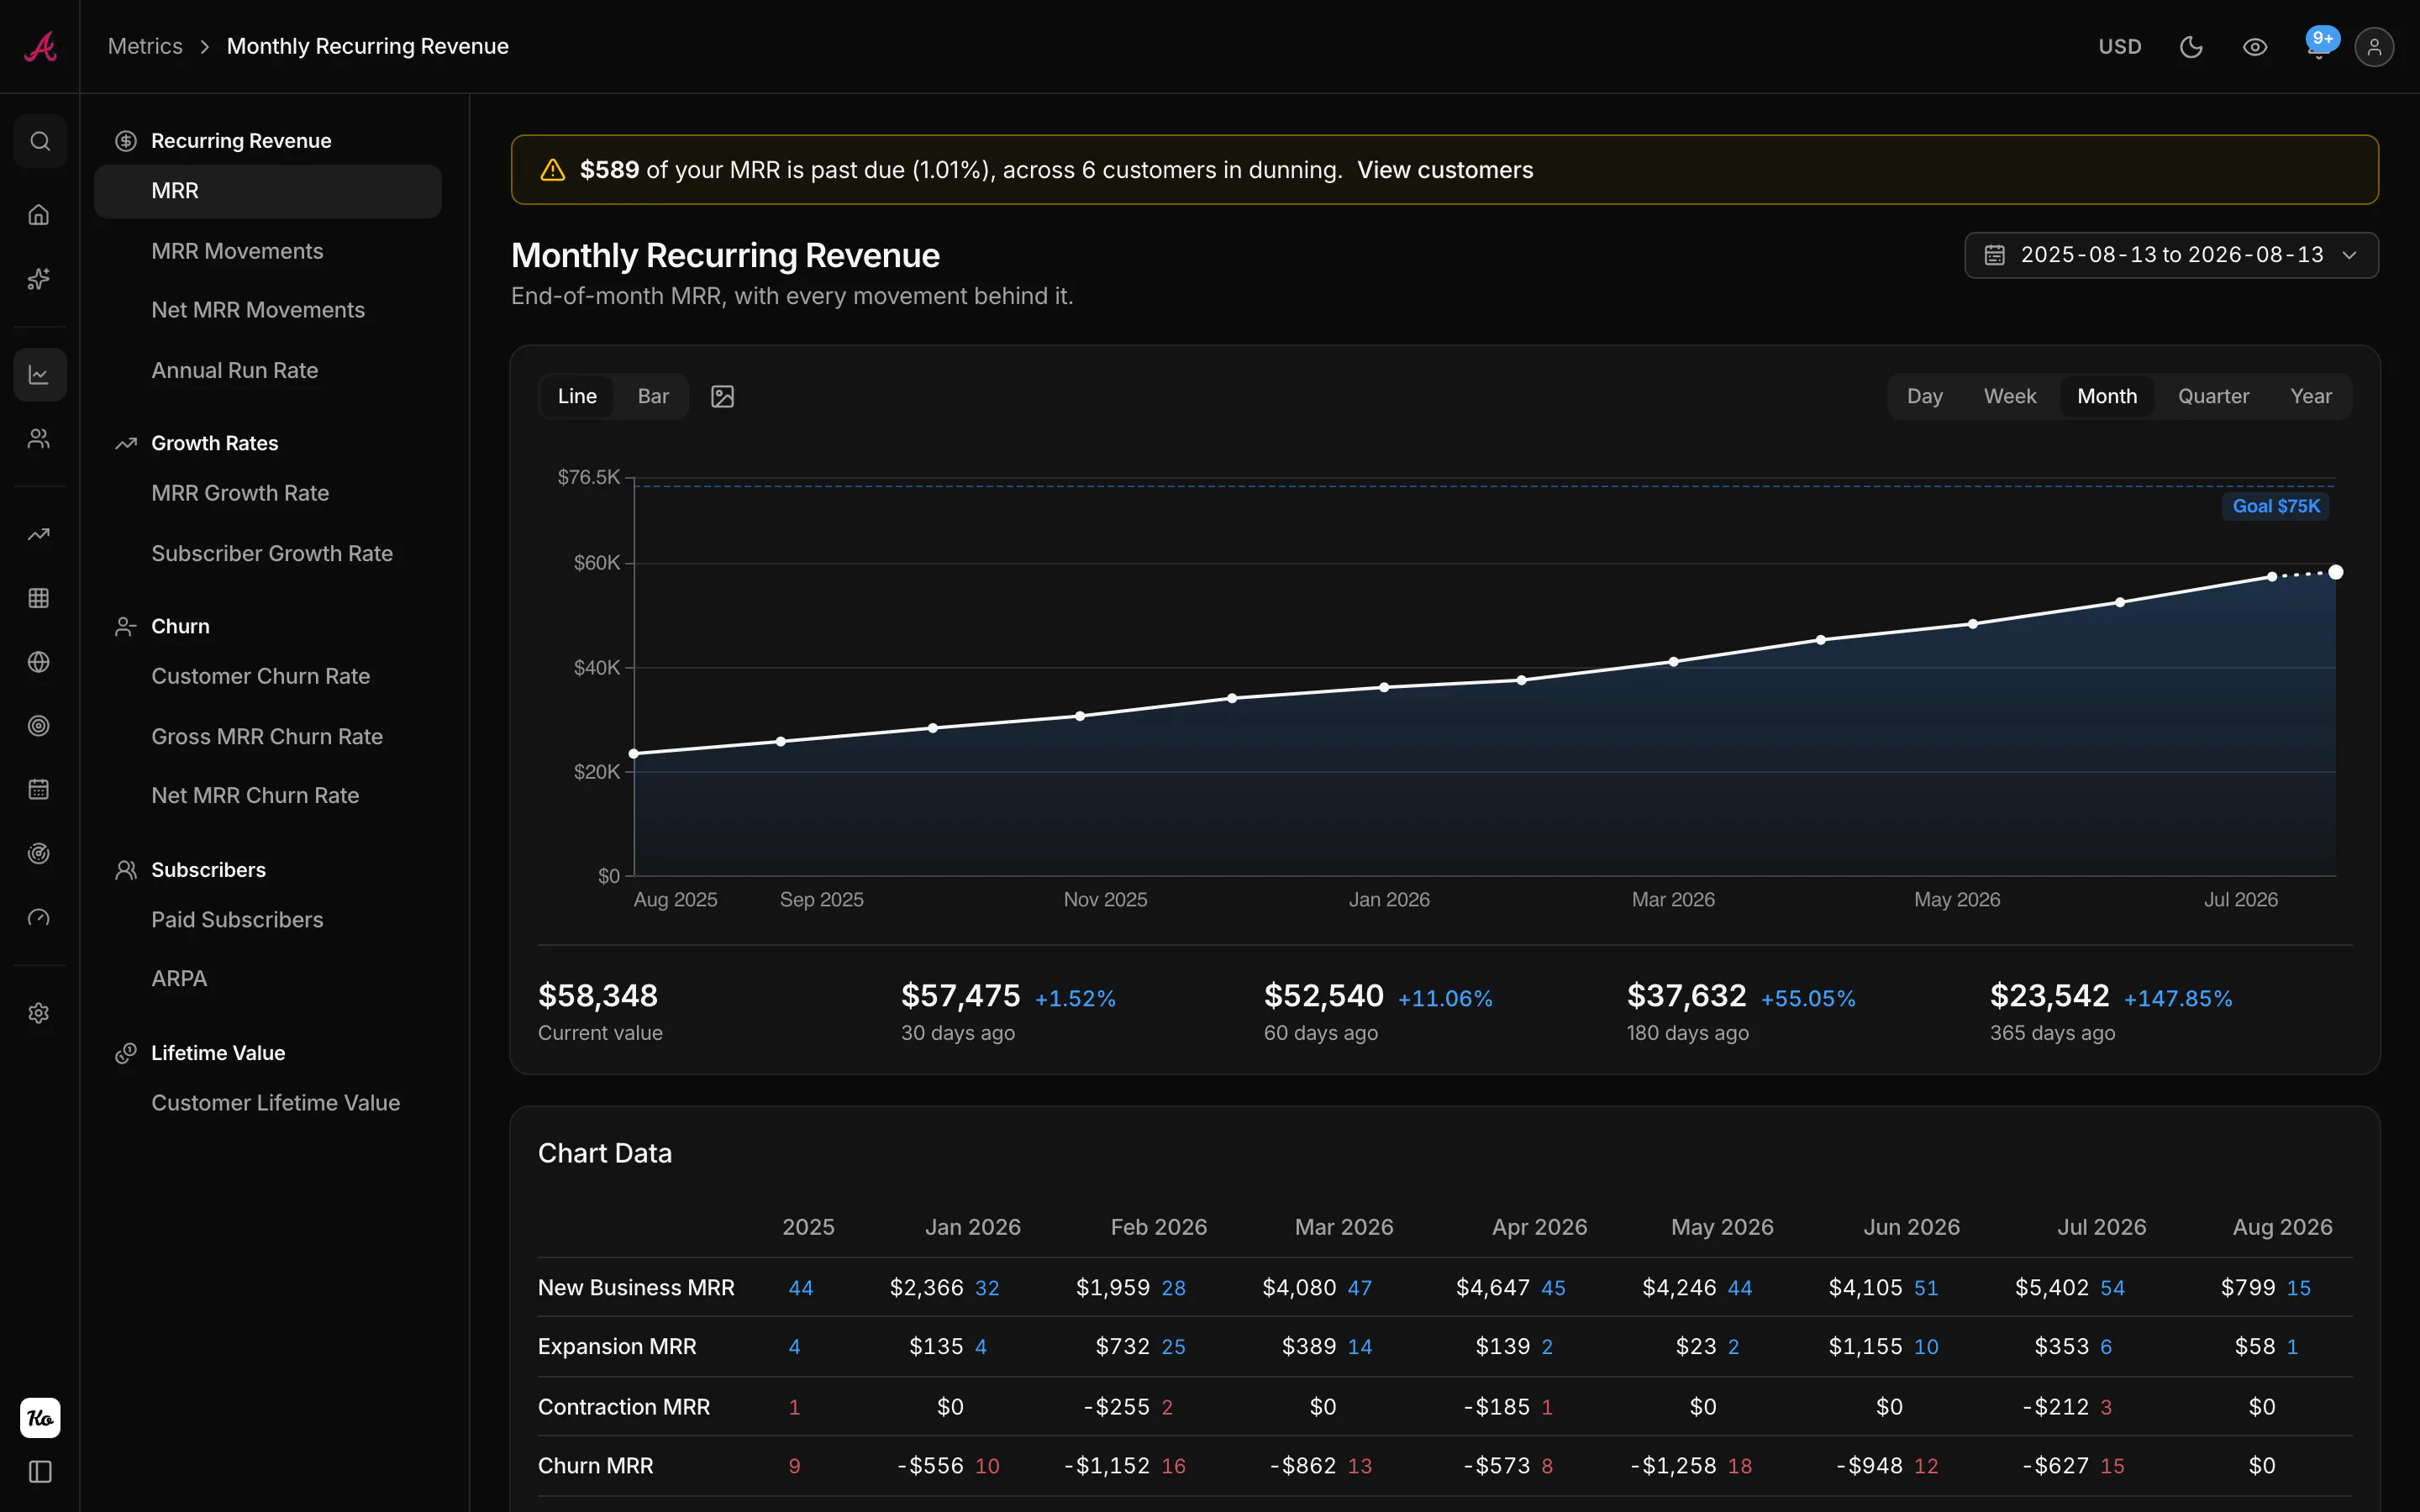
MRR, ARR, MRR movements, net MRR movements, MRR growth rate, subscriber growth rate, customer churn rate, gross and net MRR churn rate, paid subscribers, ARPA and LTV. All of them read the same ledger, so the dashboard, the report page and the API can never quietly disagree with each other.
Every chart carries the period by period table underneath it, because a chart raises questions a table answers. Click a movement cell and the customers behind that number open in place, which is usually the next thing you wanted to know anyway.
Read any report daily, weekly, monthly, quarterly or yearly. The period still running draws dotted, so a half-collected month never gets mistaken for a decline.
What it does
- Proration, coupons, discounts, plan changes and multi-currency resolved when the data is ingested, not patched afterwards
- Five granularities, from daily to yearly, on every report
- Movement cells drill through to the customers that produced them
- The same figures available over the read-only REST API
Connect your billing and see your own numbers
Free until your book passes $1,000 in MRR. A read-only key is all it takes to start, and the first sync pulls your whole history.