

What is MRR? Monthly Recurring Revenue, explained properly
MRR is the normalized monthly value of your active subscriptions. The formula, a worked example, the five movements, and the billing edge cases that quietly make the number wrong.
By Pedro Campos

Most subscription businesses end up with two MRR numbers: the one in the billing provider's dashboard and the one in the spreadsheet somebody maintains for the board deck. They disagree. The gap is almost never arithmetic. It is that MRR has about a dozen decisions buried inside it, and nobody ever wrote down which ones were made.
This is the long version: what MRR is, how to compute it, the five ways it moves, and the billing situations that quietly break it. If you want the one-screen reference instead, the MRR glossary entry has the formula and a worked example without the commentary.
What MRR actually measures
Monthly Recurring Revenue is the normalized monthly value of every active subscription you have right now. Three words carry the whole definition.
Recurring. The money has to arrive again next month without anyone selling anything. A subscription recurs. A migration fee does not.
Normalized. Every plan is expressed in the same unit, one month, regardless of how often it is actually invoiced.
Right now. MRR is a snapshot of the current book, a run rate. It answers "what is a month of this business worth", not "what landed in the bank". Those two questions have different answers and both are legitimate. Confusing them is where most MRR arguments start.
Why normalized is the load-bearing word
An annual plan billed at $1,200 contributes $100 of MRR in every month of its term. Not $1,200 in the month the invoice cleared and nothing for the eleven months after.
Skip the normalization and MRR becomes a picture of your invoicing calendar instead of your business. A good January of annual renewals looks like explosive growth, February looks like collapse, and neither happened. This is the single most common reason a homegrown spreadsheet stops matching the investor update.
What never counts
| Counts toward MRR | Stays out |
|---|---|
| Monthly, quarterly and annual subscription fees | Setup, onboarding and implementation fees |
| Recurring add-ons and per-seat charges | Professional services and consulting |
| The discounted price a customer actually pays | Sales tax, VAT and GST |
| Subscriptions in dunning, while retries run | Trials and freemium accounts at $0 |
| Committed platform fees on hybrid pricing | Hardware and one-off overages |
The test is the same every time: if it will not arrive again next month without another sale, it is not MRR. That does not make it unimportant. A $40,000 implementation fee is real money and it belongs in your P&L. It just does not belong in a run rate, because a run rate is a promise about next month.
How to calculate MRR
The formula is a sum over subscriptions, not an average over invoices:
MRR = Σ (subscription amount − discount) ÷ months in the billing interval
Worked through a mixed book:
| Customers | Plan | Billing | MRR contribution |
|---|---|---|---|
| 180 | Starter, $99 | Monthly | 180 x $99 = $17,820 |
| 120 | Growth, $2,400 | Annual | 120 x ($2,400 ÷ 12) = $24,000 |
| 25 | Growth, $600 | Quarterly | 25 x ($600 ÷ 3) = $5,000 |
| 12 | Growth, $2,400 less 20% | Annual | 12 x ($1,920 ÷ 12) = $1,920 |
| 3 | Starter, $99, card declined | Monthly | 3 x $99 = $297 |
| 20 | Growth trial | Not billing yet | $0 |
| 1 | Implementation, $15,000 | One time | $0 |
| 340 paying | $49,037 |
Two rows in there are the ones people get wrong. The 20 trials contribute nothing until they convert, even though they are in your customer count. The 3 declined cards stay in, which has its own section below.
Notice also what the mix tells you: the annual cohorts are 39% of the paying customers and 53% of the MRR. Averaging invoice totals instead of normalizing would have buried that entirely.
Two formulas, and when each one is right
There is a second way to arrive at the same number, from last month rather than from the book:
MRR = starting MRR + new business + expansion + reactivation − contraction − churn
These two must agree. When they do not, one of them is wrong, and it is usually the snapshot, because the ledger is auditable line by line and the snapshot is not.
They answer different questions, which is why you want both. The snapshot tells you what the number is. The ledger tells you why it changed. A tool that can only produce the first one is giving you a figure you cannot act on.
The five MRR movements
Every change in MRR is one of five things:
| Movement | What happened | Example |
|---|---|---|
| New business | Someone who was not paying starts paying | Trial converts to the $99 plan: +$99 |
| Expansion | An existing paying customer pays more | Upgrade from $99 to $299: +$200 |
| Contraction | An existing paying customer pays less | Drops 5 seats at $20 each: −$100 |
| Churn | A paying customer goes to zero | Cancels the $299 plan: −$299 |
| Reactivation | A churned customer comes back | Returns after 4 months: +$149 |
Net new MRR is what they add up to:
Net new MRR = new business + expansion + reactivation − contraction − churn
One practical warning: tools disagree on sign conventions. Some report contraction and churn as negative numbers already, some report them positive and expect you to subtract. Check before you sum somebody else's export, because getting it backwards doubles the error instead of zeroing it.
Why the split matters more than the total
Two companies both add $10,000 of net new MRR this month. The first booked $12,000 of new business against $2,000 of churn. The second booked $30,000 against $20,000. Same headline, and they are not the same business: the second one is filling a bucket with a hole in it, and it needs three times the sales output to stand still.
You cannot see any of that in the MRR line. It only shows up in the movements. That is the whole argument for tracking net MRR movement rather than the total alone.
Where MRR gets hard
Everything above is the part every article covers. What follows is the part that decides whether your number is actually right.
Discounts and coupons
MRR is what the customer actually pays. A 20% coupon on a $500 plan is $400 of MRR for as long as the coupon runs, not $500 with a note somewhere.
The decision worth writing down is what happens when a time-limited coupon expires. A three-month 50% discount ending is a genuine increase in what the customer pays, so it lands as expansion. That is correct, and it also means a promo campaign produces an expansion spike three months later that nobody reading the chart will be able to explain. Either convention is defensible. Being unable to say which one you use is not.
Failed payments and dunning
A failed payment is not a cancellation. A card expires, the retry schedule runs, the customer updates it four days later and never notices anything happened.
Drop that customer from MRR on the day the card bounces and you book churn on day one and reactivation on day four. Both are fiction. Your churn rate is now overstated, your reactivation number is inflated, and the two errors do not cancel out, because whenever a bounce lands near a month boundary they fall into different months.
Keep past-due subscriptions in MRR while dunning runs and report the exposure separately as past-due MRR. This is also what ChartMogul does: its MRR is the sum across all active and past due subscriptions. Churn gets booked when the subscription actually ends, whether that is the customer cancelling or your dunning process giving up. More detail in dunning.
Usage-based and metered billing
The perpetual edge case, and the one most guides mention and then decline to resolve.
The difficulty is twofold. Metered charges are not recurring in the sense MRR requires: 40,000 API calls this month is not a commitment to 40,000 next month. And usage is billed in arrears, so the invoice arrives after the period it covers, which makes every movement derived from it retroactive. Yesterday's chart changes.
Three defensible treatments:
| Approach | What it does | When it fits |
|---|---|---|
| Committed base only | Count the platform fee or minimum commitment, exclude the variable part | Hybrid pricing with a real base fee. The default, and what most tools do |
| Trailing average | Normalize the last three months of usage into a monthly figure | Pure usage pricing with stable consumption |
| Exclude entirely | Report metered revenue as its own line next to MRR | Usage is genuinely lumpy, or small enough not to matter |
Whichever you pick, put the choice next to the number. A pure usage business reporting a single uncaveated MRR figure is publishing something closer to a moving average than a run rate.
More than one currency
This one produces the most confusing chart in subscription analytics, and almost nobody writes about it.
If some customers bill in EUR and you report in USD, your MRR moves when the exchange rate moves, without a single customer doing anything. A euro book worth $10,000 in March is worth $10,300 in April on a 3% currency move alone.
Booked naively, that $300 lands in expansion. Now your expansion figure, which is supposed to describe customers buying more, contains foreign exchange noise, and every metric built on top of it (net revenue retention, most obviously) inherits the contamination.
Currency movement is its own movement type. It is not new business, expansion, contraction, churn or reactivation, and giving it a sixth bucket is what keeps the other five honest. Pick a rate convention too: converting each movement at the rate on its own date and converting the whole book at today's rate produce different histories, and only one of them gives you the same answer when you look at the same month twice. If you only need the arithmetic once, the MRR currency converter will do it.
Refunds, credits and taxes
Three questions that get lumped together and have three different answers.
Taxes never count. Sales tax, VAT and GST are collected on behalf of a government. That money was never yours. MRR is computed on the net amount.
Refunds of one-time charges never touch MRR, because the charge was never in MRR to begin with.
A refund of a subscription charge is the one needing a decision. A goodwill refund for a bad month does not change what the customer pays going forward, so it does not change MRR at all. A refund issued alongside a cancellation is churn, dated to the cancellation. The failure mode is deducting refunds from the MRR of whatever month they were processed in, which carves a dip into the chart that no customer behaviour explains.
Credits behave like discounts when they reduce the recurring amount, and like refunds when they are one-off goodwill.
Proration and mid-cycle plan changes
A customer upgrades on the 15th. That month's invoice is a prorated blend of two plans and matches neither of them.
MRR is a run rate, so it takes the new plan's full normalized value from the day of the change. The upgrade is $200 of expansion on the 15th, not $100 because half the month had already gone. The prorated invoice is a cash event and belongs in cash reporting.
This is precisely where the popular shortcut formula, "MRR = customers x average amount billed", falls apart. Every guide that hands you that formula has quietly assumed nobody ever changes plan mid-cycle.
Cancel and resubscribe within the same hour
A customer cancels and immediately resubscribes on a different plan, because your checkout has no upgrade path or because support did it by hand.
Read literally, that is churn followed by new business. Both numbers are now wrong: churn is inflated by a customer who never left, new business by a customer who was never new. What actually happened is expansion or contraction, depending on direction.
The fix is to merge movements for the same customer inside a short window, an hour is plenty, and classify the net effect. Kometrics merges within an hour, and ChartMogul does something equivalent under the name reclassification. Without it, any business with a manual plan-change process reports a churn rate that is simply not real.
What a good MRR growth rate looks like
Once the number is trustworthy, the next question is whether it is any good. ChartMogul's benchmark data across its customer base:
| Cohort | Monthly MRR growth |
|---|---|
| Median | 2% to 2.5% |
| Top quartile, early stage | 5% to 7% |
| Top decile, early stage | 10% to 17% |
| Top decile, past $3M ARR | 6% to 7% |
Monthly percentages compound in a way that makes those gaps larger than they look. 2.5% a month is 34% a year. 5% is 80%. 7% is 125%. The distance between median and top quartile is not a rounding difference, it is the difference between a business and a considerably better one.
A useful second reference point, because it measures a different population: SaaS Capital's 2026 benchmarking of bootstrapped companies between $3M and $20M ARR puts median annual growth at 15%, with the 90th percentile at 42%. Bootstrapped, capital-constrained growth is slower than the venture-backed figures that dominate the discourse, and 15% is not a failure.
On the retention side, median net revenue retention sits around 103% to 105% depending on the dataset, and it splits hard by segment: roughly 118% for enterprise, 108% for mid-market, 97% for SMB. If you sell to SMB and your NRR is below 100%, that is your market, not your product. The NRR calculator will work out yours.
How to audit your own MRR
Six checks. A number that cannot pass them is decoration.
- Does the snapshot equal the ledger? Take last month's MRR, apply the five movements, compare against this month's total. Any difference means something is in the total that never produced a movement.
- Hand-check your three largest annual customers. MRR should be contract value ÷ term months, net of discount and tax. This finds the annual-invoice-spike bug in about five minutes.
- Compare movement counts against your billing provider's event log. Same number of cancellations in both? If yours is higher, you are probably booking dunning as churn.
- Look for expansion with no matching subscription change. Every dollar of expansion should point at an upgrade, a seat addition or a discount expiring. Unattributable expansion is usually currency drift or a proration artifact.
- Re-run last quarter's numbers today. They should be identical to what you reported then. If history moves, either you have retroactive usage billing (expected, note it) or your exchange rates are not pinned (a bug).
- Confirm trials, one-time fees and taxes are all out. The three most common contaminants, in that order of frequency.
MRR, ARR, revenue and cash
| Number | What it answers | Common mistake |
|---|---|---|
| MRR | What a month of the current book is worth | Treating it as cash received |
| ARR | MRR x 12, the same thing in annual units | Annualizing an unusually good month |
| Bookings | What customers have committed to | Reporting it as ARR |
| Recognized revenue | What accounting has earned this period | Expecting it to match MRR |
| Cash collected | What actually landed in the bank | Expecting it to match anything |
All five are correct and they disagree with each other on purpose. A business selling annual contracts up front collects the cash long before it recognizes the revenue, and its MRR is smoother than either. ARR in particular carries no information MRR does not; it exists because boards and comparables are quoted in years.
Track it without the spreadsheet
Everything above is implementable in a spreadsheet. The arithmetic was never the hard part. The hard part is that the spreadsheet has to be re-derived every month, and the edge cases (dunning, currency, proration, reclassification) are exactly the ones that get skipped when the deck is due tomorrow.
Kometrics connects to Stripe and builds the movement ledger from your billing history, then derives MRR from that ledger. There is no stored MRR number to drift out of sync: the chart and the movement breakdown are two views of the same data, which is why they cannot disagree. Past-due customers stay in MRR with their exposure reported separately, currency movement gets its own bucket, and a cancel-and-resubscribe inside an hour is merged before it can become fake churn. The metrics feature page covers how each number is computed.
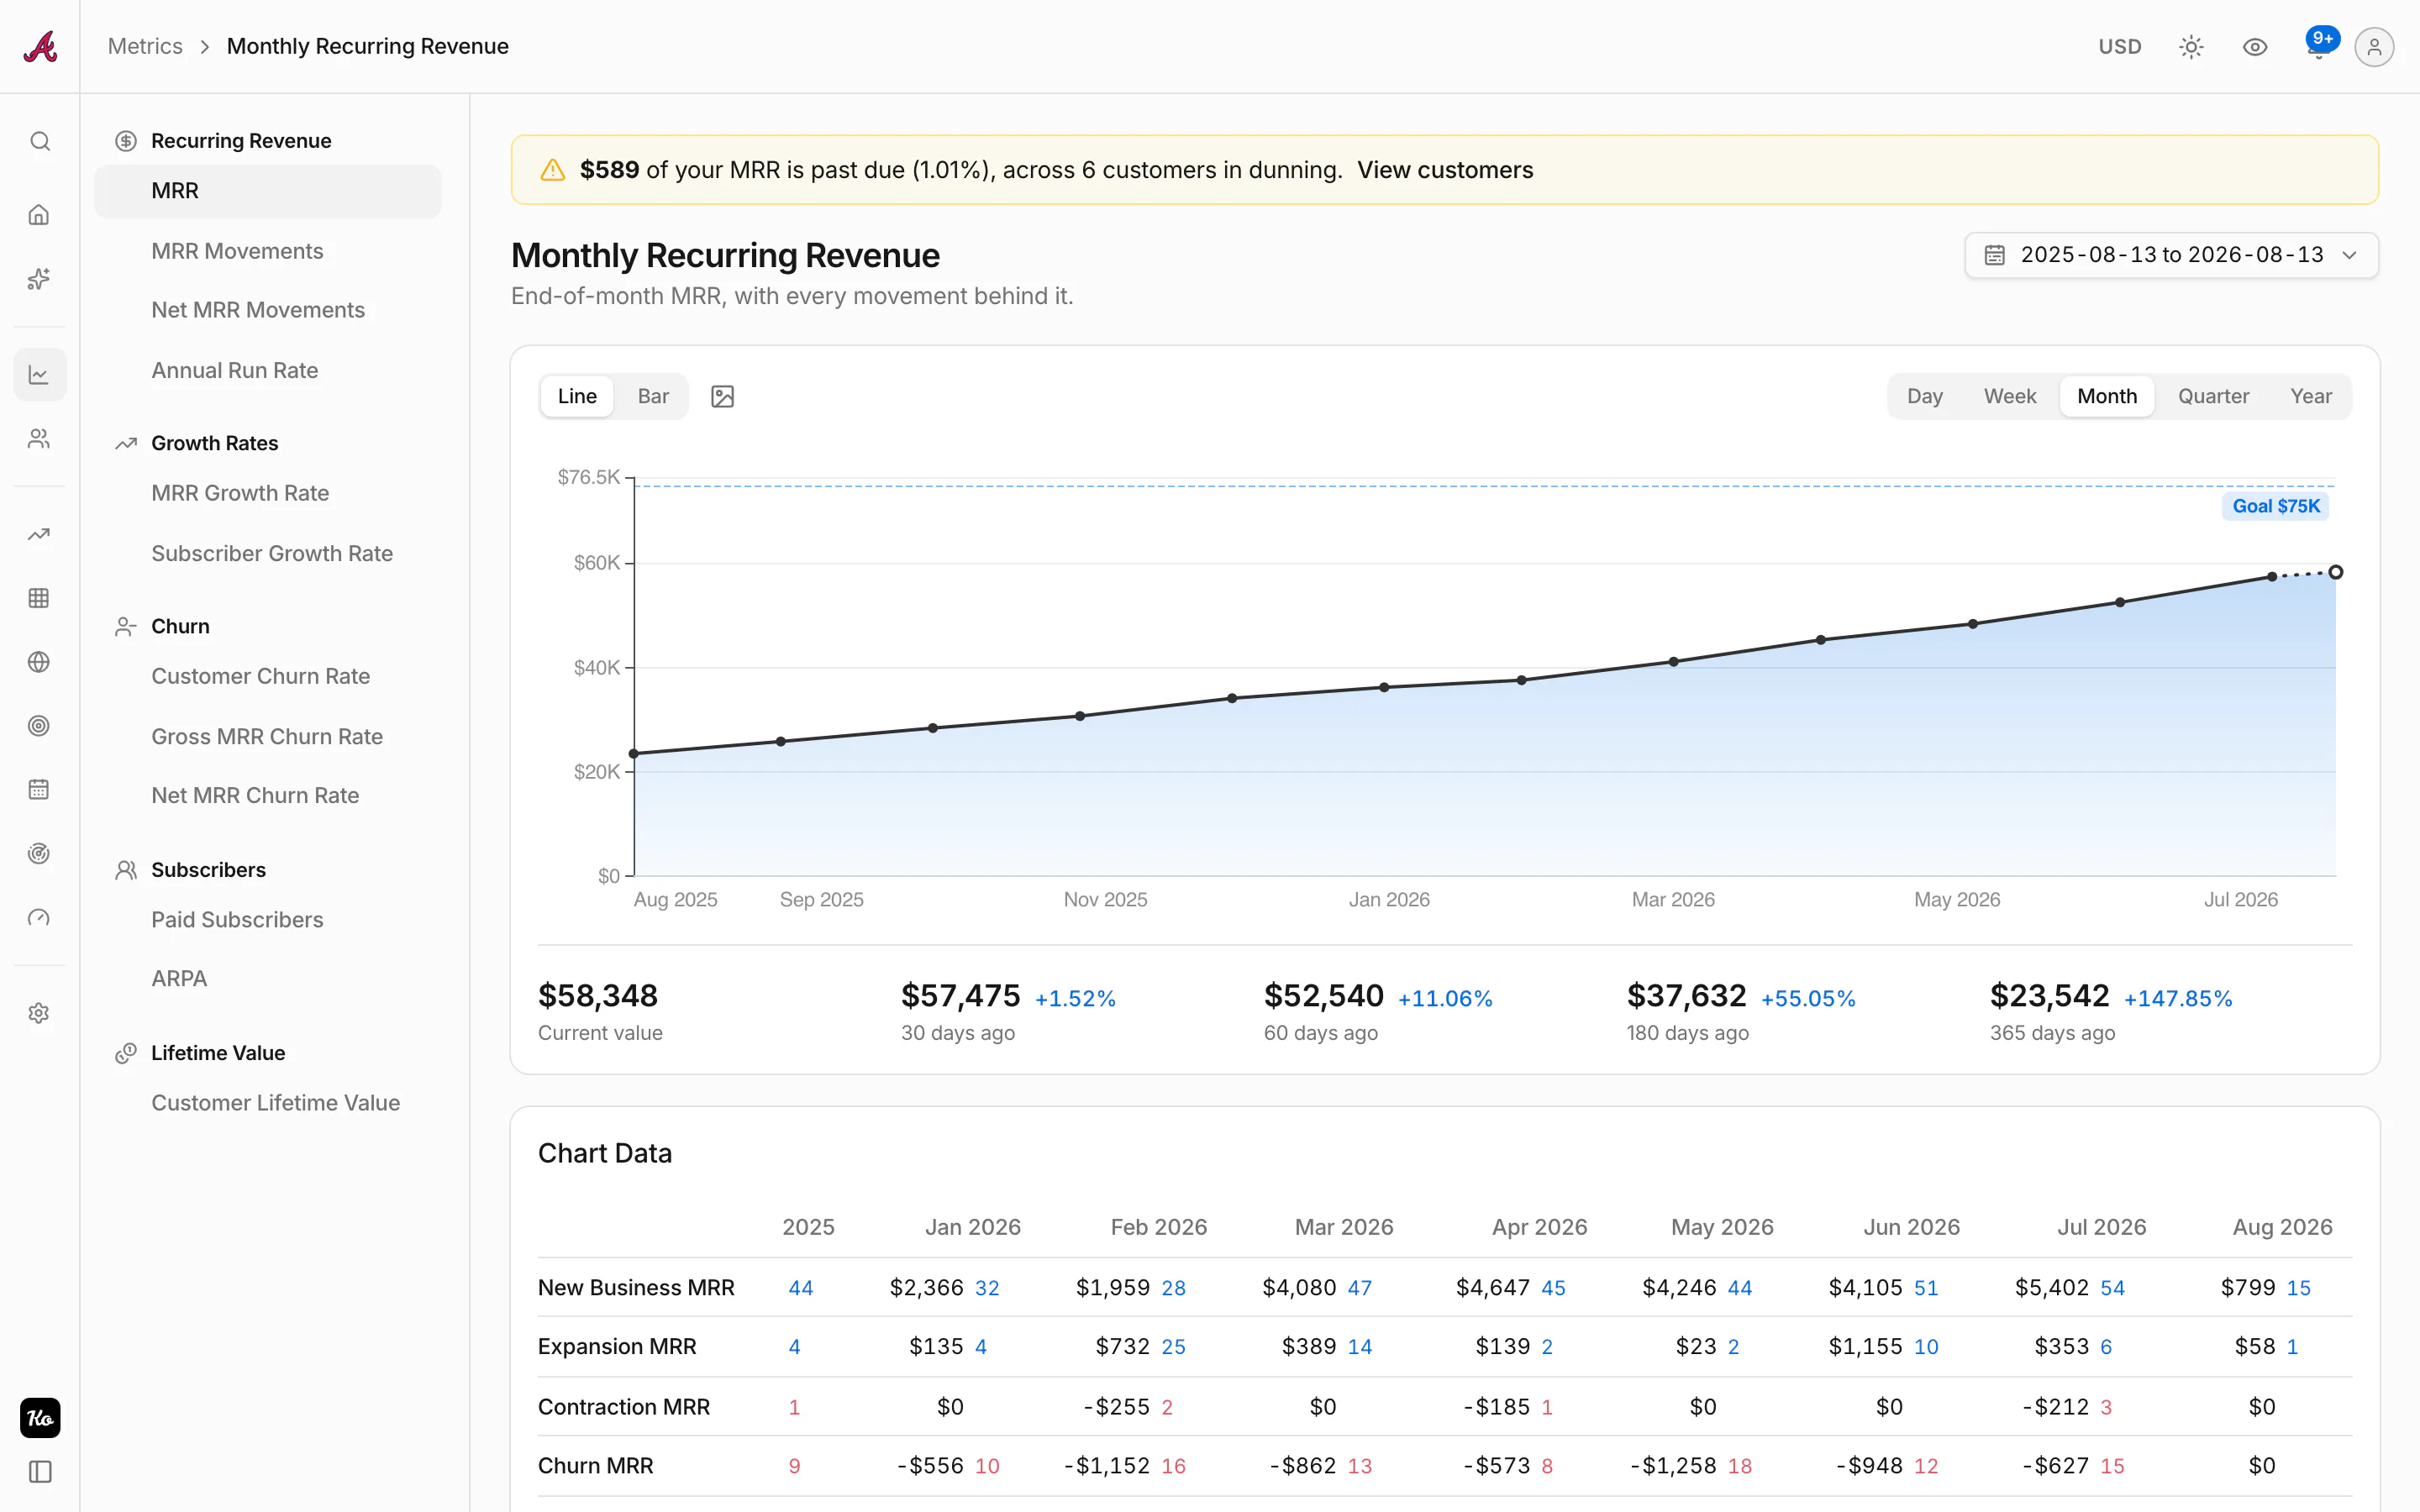
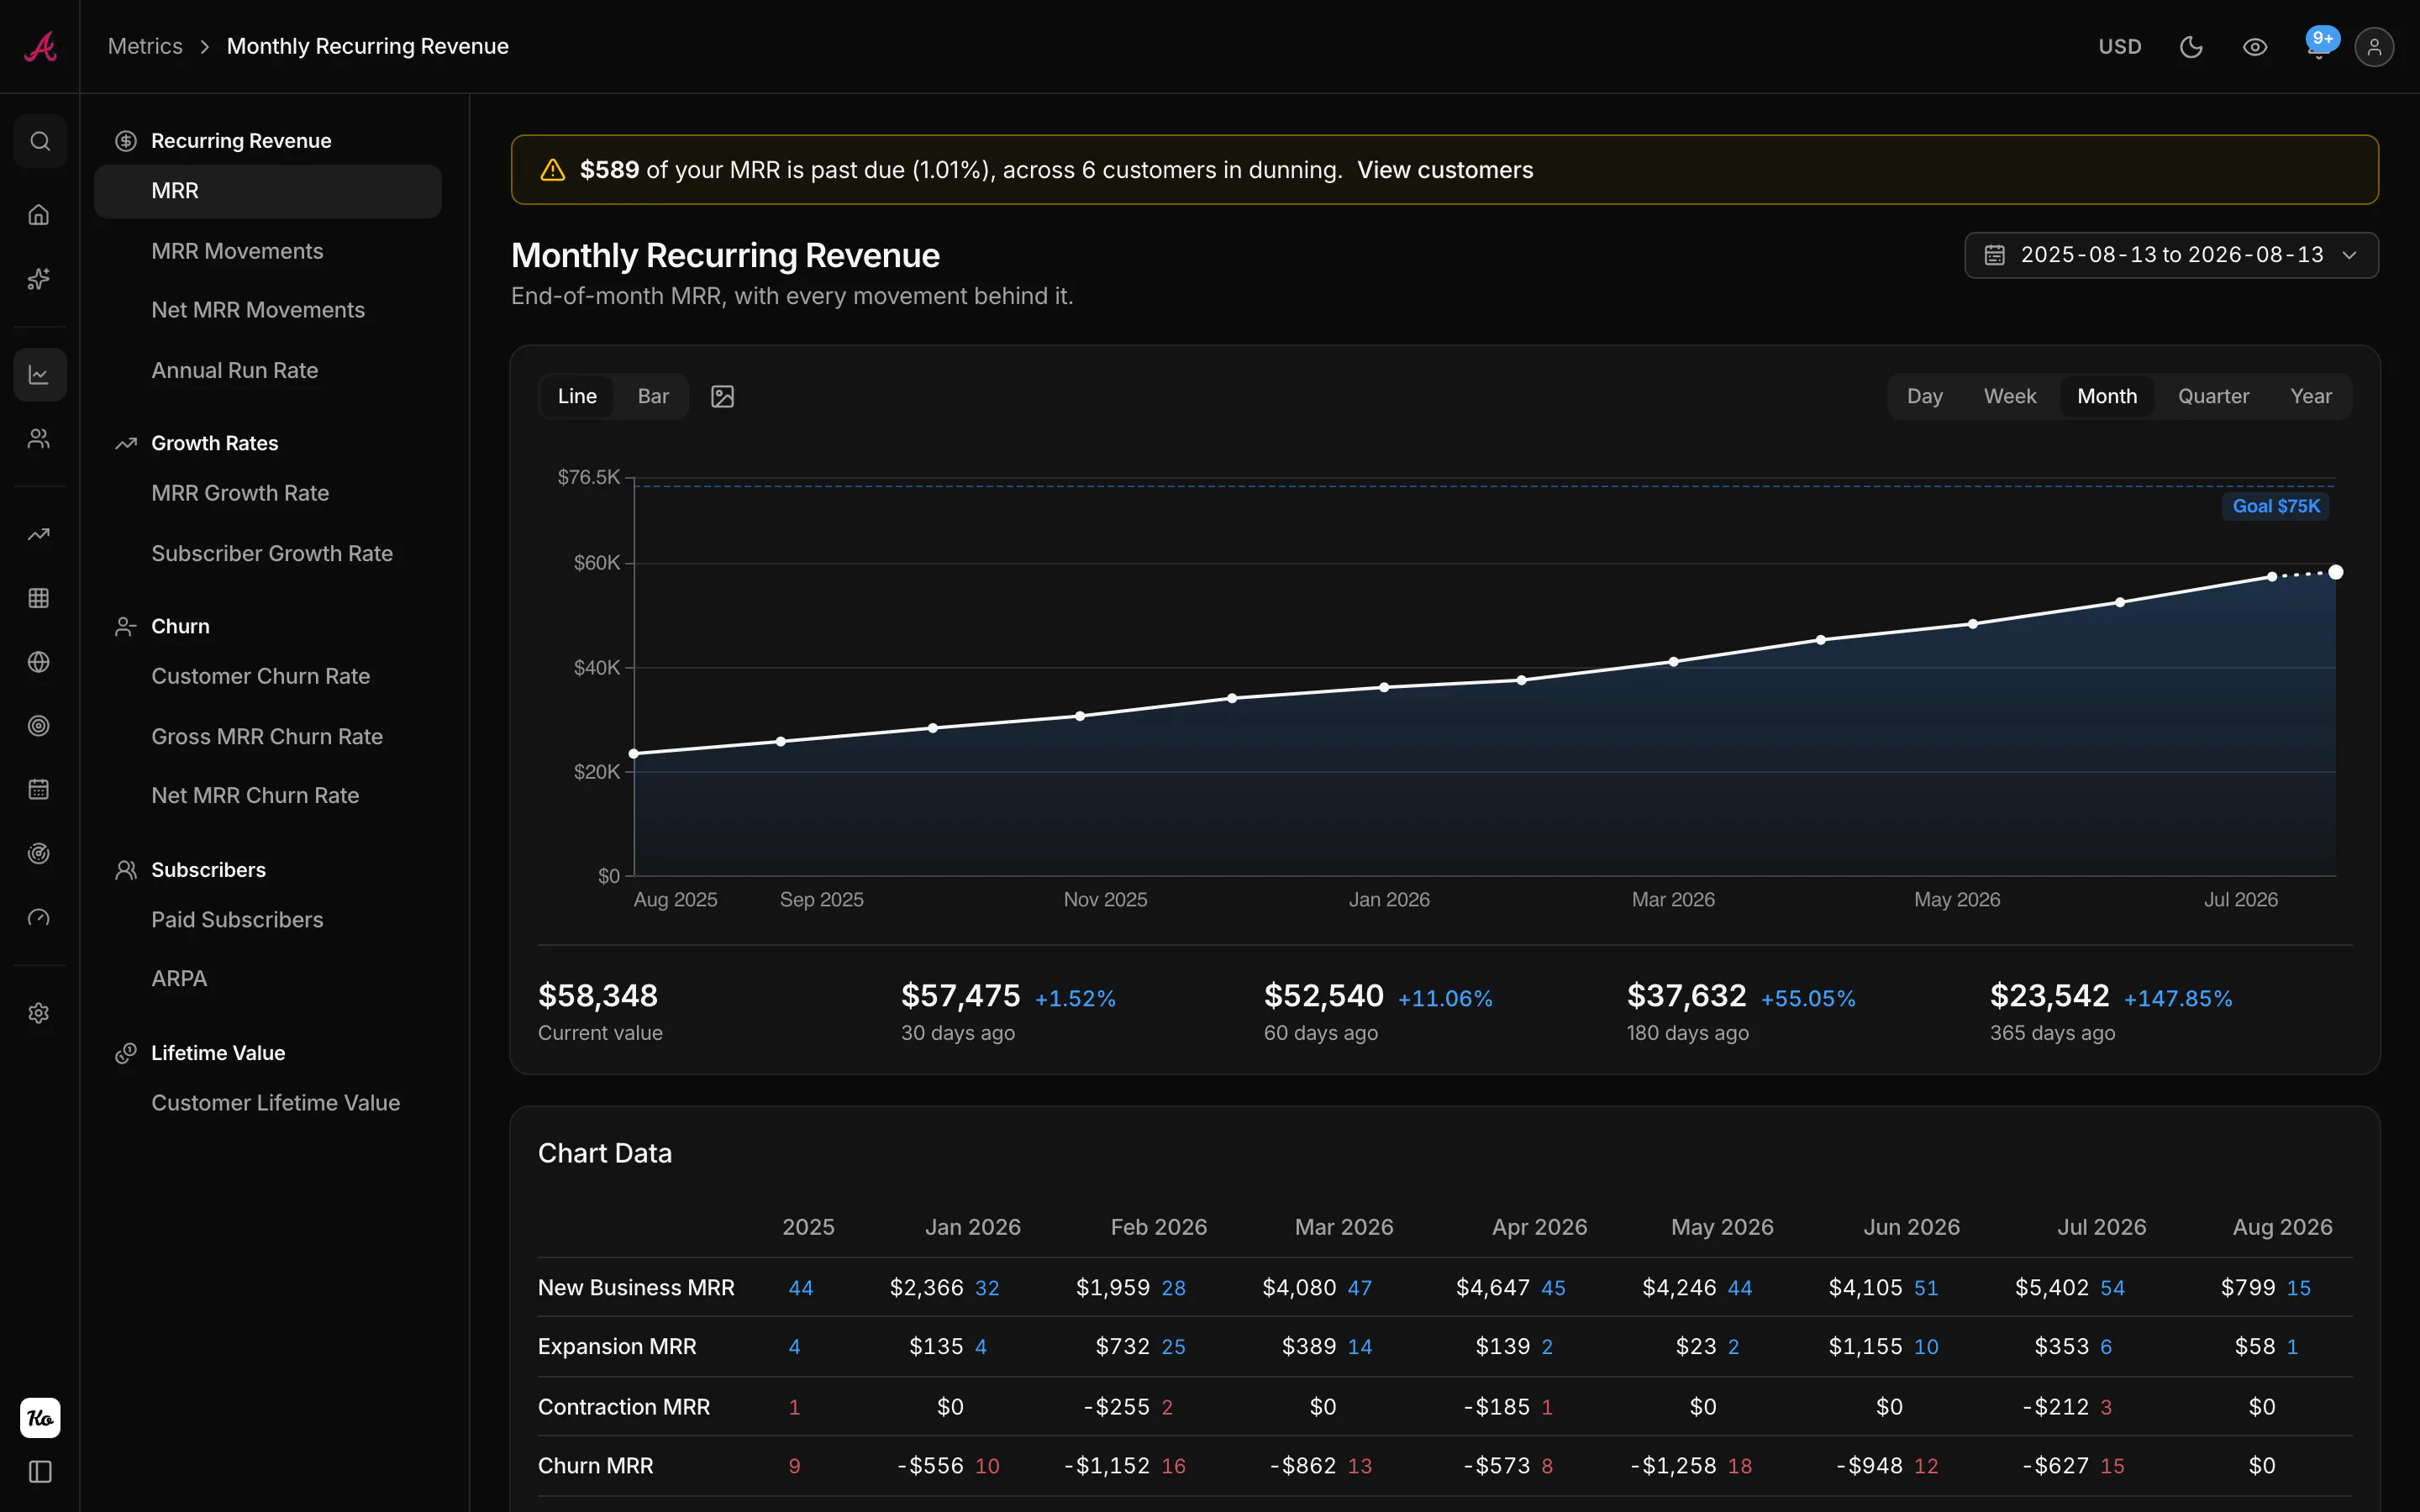
And once the ledger exists, the two-formula argument from earlier stops being theory. The snapshot says what the number is; the movements say why. Ask, and both arrive together:
It is free under $1,000 MRR. And if you just need one calculation right now, the MRR calculator and the churn rate calculator are free and need no account.
Sources
- ChartMogul, Monthly Recurring Revenue (MRR) and What Is a Good Monthly Growth Rate in SaaS?
- Baremetrics, MRR: How to Calculate Monthly Recurring Revenue
- Stripe, Monthly recurring revenue (MRR) explained
- SaaS Capital, 2026 Benchmarking Metrics for Bootstrapped SaaS Companies
Know your revenue. Trust the metrics.
Connect Stripe and get every SaaS metric computed from your real billing history. Free under $1,000 MRR.
Start freeKeep reading

Gross churn vs net churn: the leak, and what covers it
Gross MRR churn measures what you lost; net churn subtracts the expansion that covered it. Formulas, a worked example, negative churn, and why quoting only one of them misleads.

Paddle vs Stripe for SaaS: merchant of record or payments platform
Paddle and Stripe are different species: one becomes the seller and handles global tax for 5% + 50¢, the other gives you the best payments infrastructure and leaves compliance to you. The real comparison, with the math.

Bookings vs revenue: what you sold, what you earned, and what hit the bank
Bookings measure commitments, revenue measures delivery, and cash measures timing. The differences explained with one annual contract, plus where MRR and ARR fit in the picture.